 Hi FME’ers,
I’d promised to post a couple of examples of creating HTML reports with FME, and here is one of them.
Here I was creating a Point-in-Polygon example as part of our FME for GIS Tutorial. Because there can be more than one point in a polygon, part of the article needed to discuss what to do with that data, and I thought a HTML report would be perfect.
So here’s what I did.
![]()
Scenario
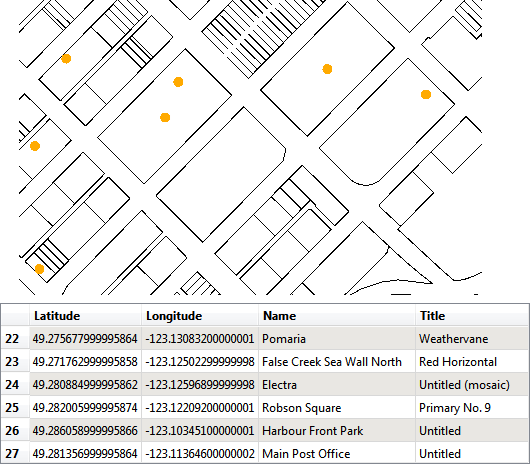
The scenario was one that I’ve used in training courses before: we have a list of public artworks for the city of Vancouver, a dataset of city property boundaries, and wish to find which artworks reside on city property.
The FME part of this involves a simple combination of PointOnAreaOverlayer and Tester transformers:
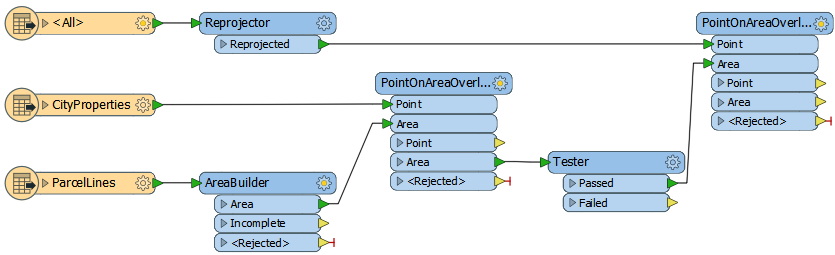
But I want to get the results as a HTML report, and that is now very easy to do.
![]()
HTMLReportGenerator Transformer
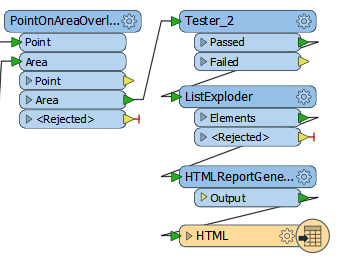
The second of those PointOnAreaOverlayers creates a list of artworks for each city property. To be able to write that to HTML I just need to explode that list and set up the HTML with the HTMLReportGenerator transformer:
Let’s take a look at the HTMLReportGenerator’s parameters dialog:
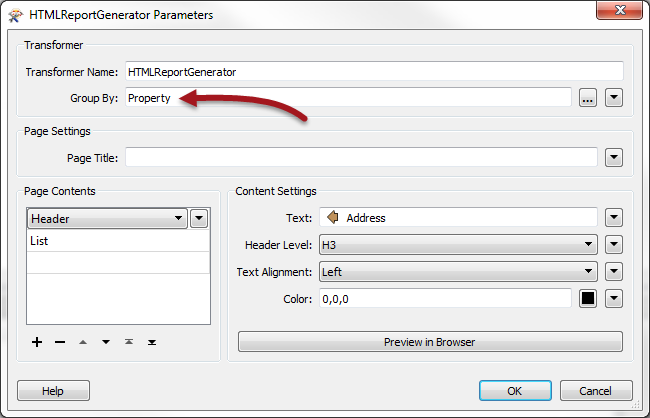
The key part there – which is why I’ve highlighted it – is the Group By. This means I am going to get a separate report for each property (or property ID attribute to be exact).
I’ll say it again because it’s so important, I get a separate report for each property. In my example I get 40 features exiting the HTMLReportGenerator transformer:
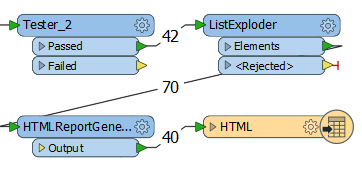
NB: The reason we have 42 properties pass, but only 40 reports is – I think – because a couple of the properties have the same ID number.
Anyway, the Header content therefore creates a header per report, and the list is also a list of properties per report. The output looks like this:
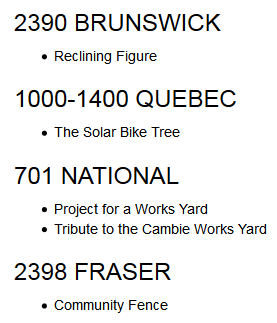
If I didn’t do the group-by I would get a list of artworks, but I wouldn’t be able to have the address as a header for each.
Now you might be thinking, “but that’s just one report” – and in a way you’re right. It’s because I wrote it all to the same HTML file. So the above screenshot shows four reports, all written to the same web page (html file). But that’s good because it lets me do some other things to the HTML.
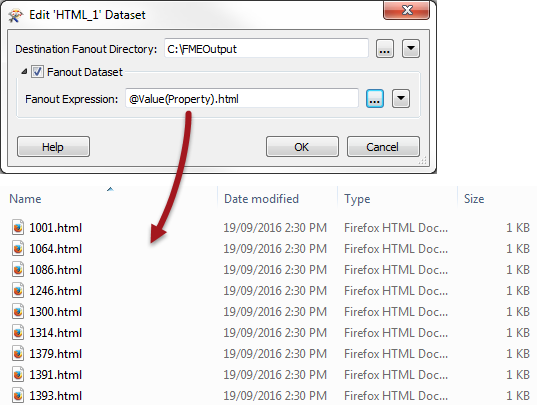
For example, I might do a dataset fanout on the property attribute, to create a separate HTML file per report:
The other thing I might do is use the HTMLLayouter transformer.
![]()
HTMLLayouter Transformer
The HTMLLayouter transformer – yes I know it’s a strange name, but that’s what it does – arranges incoming reports into a nicer layout.
The parameters dialog looks like this:
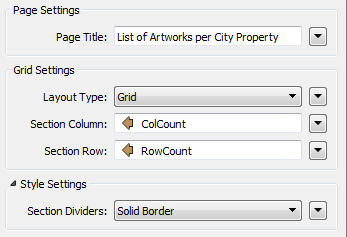
Besides Grid, the other Layout Type is Vertical, which is pretty much what I was getting anyway, so I’ll concentrate on grid.
Now the grid settings are not what you might think – at least they didn’t do what I thought. I thought you would specify the number of rows and columns, and the transformer would lay the reports out according to those values. However, this is NOT what it does.
Instead, you define the location of each report using attributes; so if I have 40 features and want 10 rows and 4 columns then I have to number my reports with their location in that grid. The easiest way I found of doing that was like this:
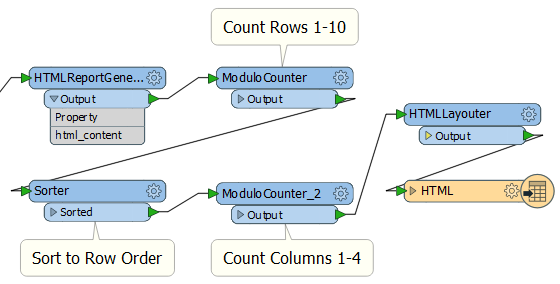
The ModuloCounter is a little-known and very much underused transformer in FME. It’s ideal for scenarios like this. It counts like the Counter, but only from 0 to a given number, in this case 10. Then it repeats the sequence again. So here I number my reports 1,2,3,4,5,6,7,8,9,10,1,2,3,4,5,6,7,8,9,10,1,2,etc – to identify the row they are designated to.
Then I sort the data into row order using a Sorter, so I have 1,1,1,1,2,2,2,2,3,3,3,3,4,4,4,4,5,5,5,5,etc
Then I use a second ModuloCounter to create a column number from 0 to 4. That gives me row/column pairs as [1,1];[1,2];[1,3];[1,4];[2,1];[2,2];[2,3]; etc
Selecting those attributes (as in the parameters dialog above) gives me this output:
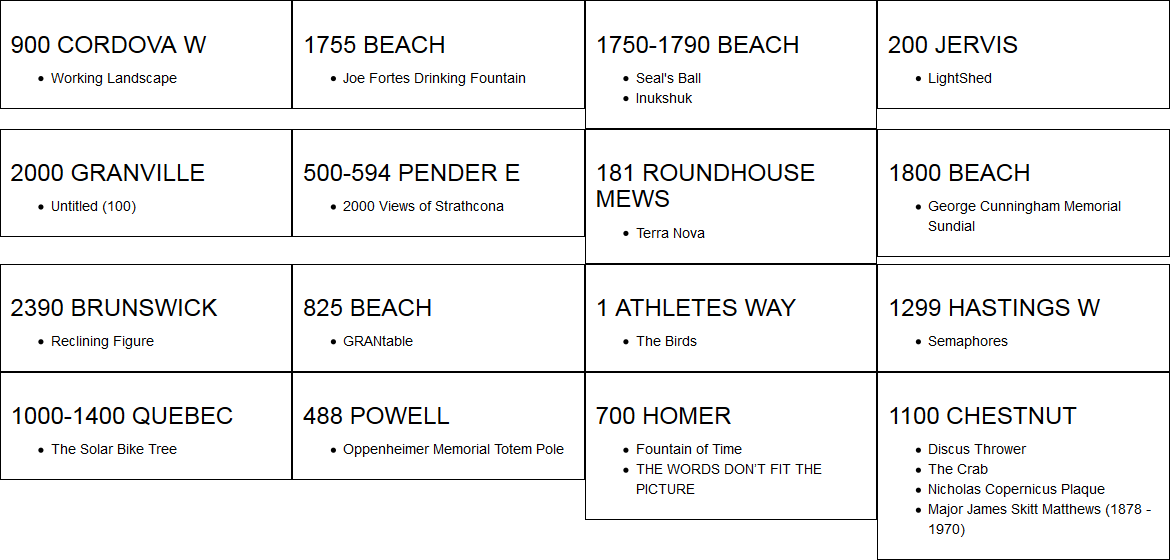
Hurrah! I have a 10×4 grid of results (I only show the first four rows in the above screenshot).
And the next time I am in Vancouver I will go to 700 Homer Street and see if there really is a piece of artwork called “THE WORDS DON’T FIT THE PICTURE”!
![]()
I hope you liked this post. I think the tips on the HTMLLayouter should be quite useful when you’re preparing HTML reports.
The GIS tutorial example didn’t include the HTMLLayouter transformer so I shared that workspace on Dropbox for you to have as well.

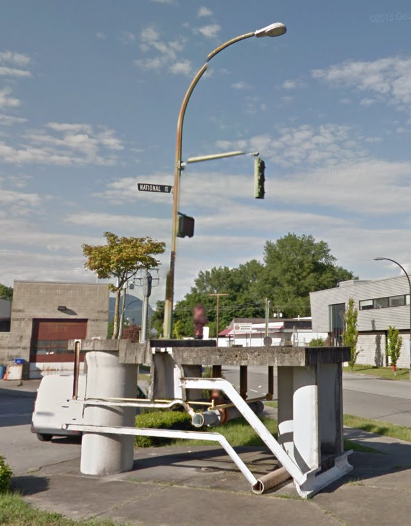
ps – my favourite piece of public art in Vancouver is “Project for a Public Works Yard“. You’ll see it if you come into Vancouver by train. It’s like a section of street and street furniture has been raised up to display the utilities that feed it! You can go and see it for yourself when you are here for next year’s FME International User Conference 2017.

Mark Ireland
Mark, aka iMark, is the FME Evangelist (est. 2004) and has a passion for FME Training. He likes being able to help people understand and use technology in new and interesting ways. One of his other passions is football (aka. Soccer). He likes both technology and soccer so much that he wrote an article about the two together! Who would’ve thought? (Answer: iMark)