GIS and medical research may not be two fields you’d expect to see join forces. But the University of Oxford and the Oxford Eye Hospital are charting new territory: they’re mapping the eyes of human ophthalmology patients to assess the progress of genetic eye diseases that currently have no cure, and to document the effectiveness of new trial treatments.
I recently interviewed Jasleen Kaur Jolly, MSc BSc(Hons) MCOptom, the mastermind behind this brilliant innovation.
Congratulations on being shortlisted for the AGI awards. What inspired you to consider applying GIS technology to eye disease research?
Thank you. A chance conversation with Jonathan Moules, an FME Certified Professional, showed me the potential applications of GIS in the analysis of ophthalmic data, in particular the scans to examine the health of the back of the eye, and visual field testing to assess the side vision. This led to an important partnership to explore the use of GIS for ophthalmic data.
What does mapping the human eye help you achieve?
A lot of what we do is map aspects of the back of the eye to measure how some diseases change the cells in the eye. I also map aspects of patients’ vision in order to understand how they see the world. Using FME to create a visualisation of that has been helpful in not only allowing us to see changes over time but also in explaining to patients what the test results are!
Mapping the visual field of the human eye
Your research of choroideremia has recently been accepted for publication in Investigative Ophthalmology and Visual Science. How are you applying GIS technology?
Choroideremia is a genetic disease that causes blindness by the patient’s 30s, for which there is currently no cure. But we’re hoping to change that. Our research is related to the experimental treatment (video) currently in trial.
We have involved GIS & FME in the quantitative analysis of autofluorescence (AF) scans of the back of the eye. These are images taken with a specialist scanning laser with a wavelength of 488nm and shows up which parts of the retina are alive and which are dying or dead. For this disease, discrete islands of surviving cells are visible. I measured the size of these islands using specialist software Heidelberg Eye Explorer, which takes into account eye shape.
Jonathan Moules of LightPear Solutions generously offered his GIS expertise for our project pro bono. He created FME workflows that automatically georeferenced the scanned raster images of the back of the eye (using markings at the centre of the retina and the optic nerve as determined by the clinician), then extracted highlighted areas of the eyes of the 50 patients in the study.
The polygons were then area-on-area overlapped to determine which areas of the eye were most prone to disease. This overlapping method also allowed us to monitor treatment effect over time. QGIS was then used for creating maps from the shapefiles which had been generated by FME from the overlapped images.
The phase 2 trial for gene therapy has just begun, and will involve a larger cohort of patients to be treated.
You’ve also been using GIS for another disease trial. How does this research differ?
We ran a trial for a new experimental treatment for Retinitis Pigmentosa, another genetic disease that results in blindness by early to middle age. We developed a new method of analysis for the AF images in this disease, which is being published in Translational Vision Science & Technology.
FME was again used to automatically georeference rasters, taking the resultant images and performing various analyses on them, we:
- Created a kind of “Terrain Profile” of the reflectance values of the back of the eye along a transect.
- Designed automatic classification based on greyscale values to try and highlight a “ring” that we know is a marker for progressive disease.
- Extracted the number of incidences along various axial-lines where the raster value was within a specific luminance range.
- Determined the proportion of the image that had raster values below a certain value.
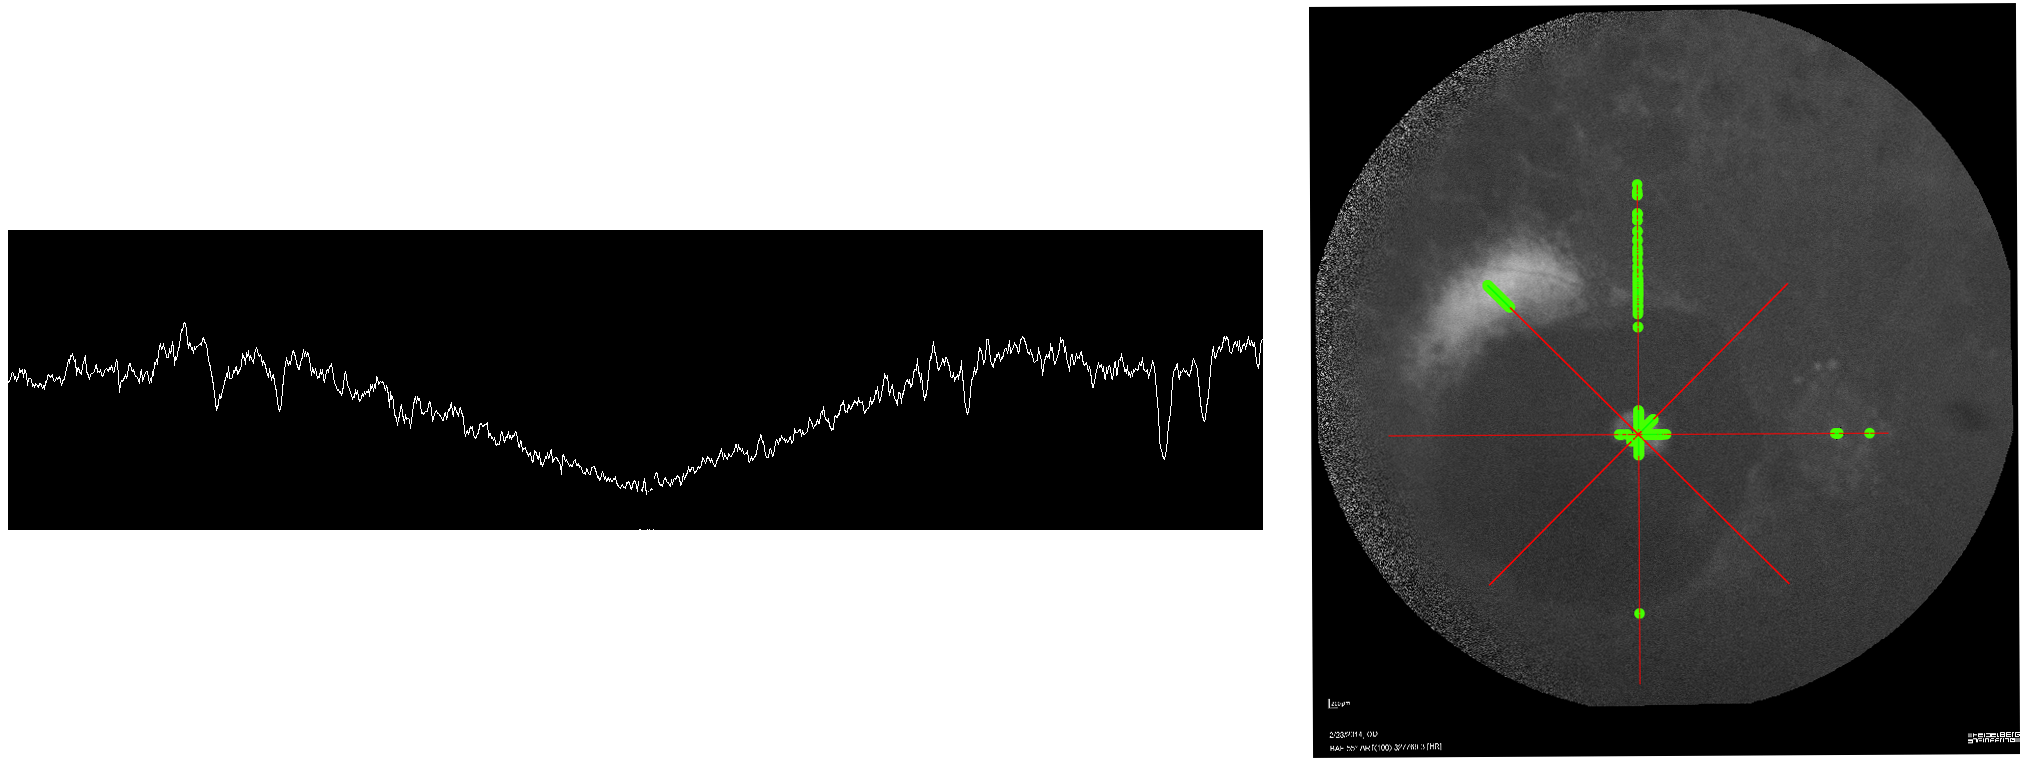
Left: Terrain Profile. Right: This image demonstrates the ring (bright patch in the very middle) and the points with values higher than a certain value (large green dots).
The results of these analyses were then used to quantify changes in the disease processes, measuring how quickly or slowly the disease changes occurred, and to monitor treatment.
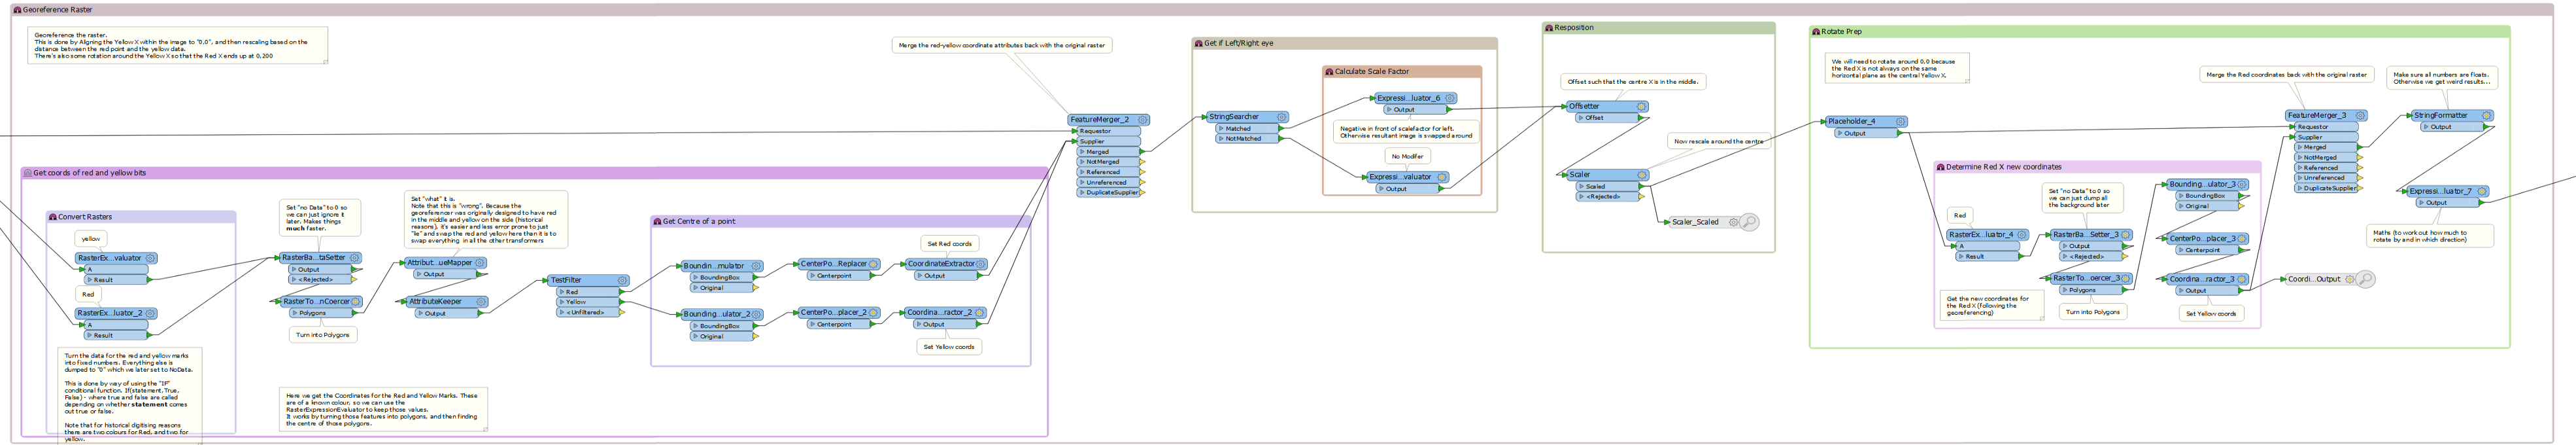
FME was used to georeference input raster images to correct for differences in magnification and orientation, and then to perform various analyses. (Click to zoom.)
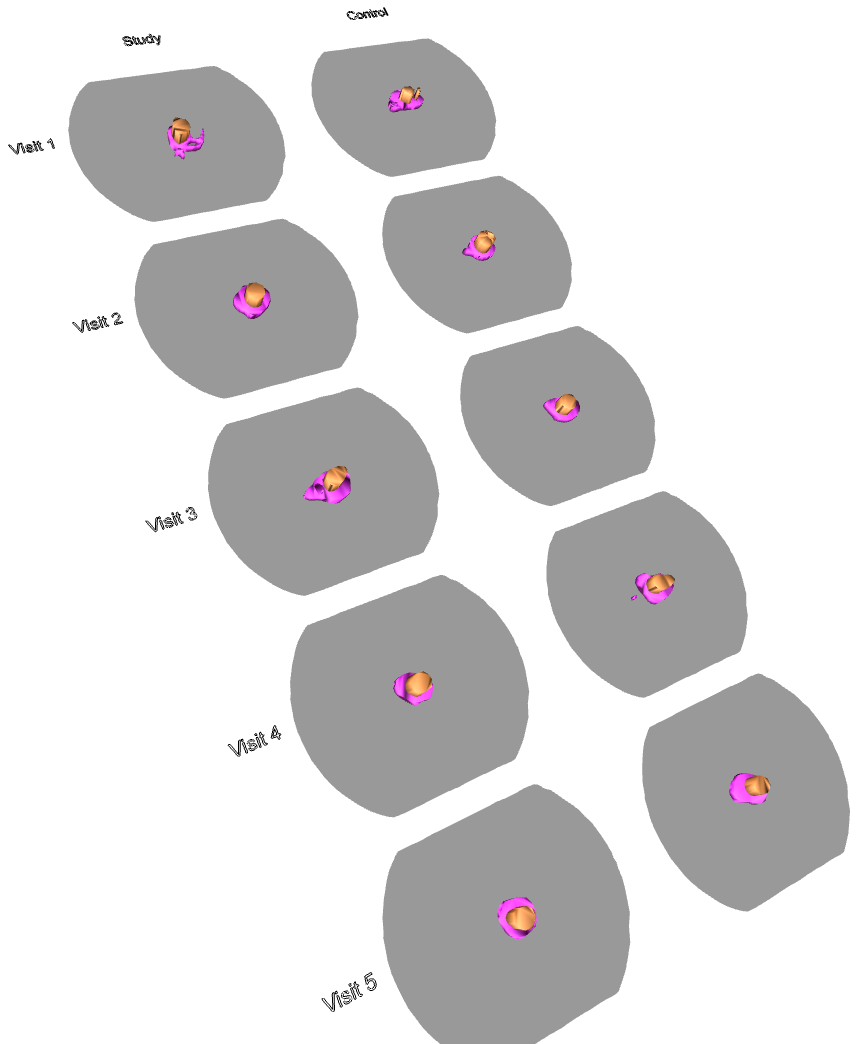 In the same project we mapped visual fields; how much of the side vision patients are able to see. The 2D results of visual field areas were digitised into a CSV file of coordinates which was converted by FME into polygons which were then extruded into 3D models and output as 3D PDFs. These allow comparison of the trial data over time. For conference presentations Jonathan created an animated GIF with FME (above), and I created a flyby of the 3D PDF to demonstrate this process and its output.
In the 3D PDF to the right, the study eye was treated but the control eye was not. The coloured areas on the plot represent areas seen by the patient, with purple denoting visible area in response to a large light and brown being a smaller light. As you can see, the area visible to the patient expanded in the treated eye over time (visits were 3 months apart) but stayed the same in the control eye.
The work with Retinitis Pigmentosa is continuing by improving the quantification methods with a hope to use them in the future in new treatment clinical trials.
How else do you plan to apply GIS to medical research?
We are hoping to expand the work to other diseases in the future. We’ve also had interest from others in the field, in seeing how FME can help us analyse images for eye diseases they’re doing research for. FME could play a vital role in assessing the success of therapies.
Each disease affects the cells in different ways, and so presents with a different pattern on the pictures we take of the eye. We are looking to develop methods of image analysis for various diseases with FME and other GIS tools, and to improve the methods we’ve developed.
What are your thoughts about working with GIS overall?
Valuable lessons can be gained from other professions, which is why we’re seeing cross domain working becoming more popular. For our part, ophthalmic imaging contains spatial features, and therefore using software that has been designed for spatial data allows us to draw more information from our data and develop innovative ways to analyse the data.
GIS software provides built-in tools that make it easier to perform complex analyses on spatial data as well as allowing the ready creation of easy-to-understand visualisations. The automation that GIS software is designed to perform has allowed us to create protocols for repeatable analysis techniques that can be used across trials and therefore provide comparable results with different treatments. It has also increased our efficiency by automating otherwise labourious parts of the process.
Our work has demonstrated that GIS technologies can be adapted for ophthalmology, showing that GIS can provide innovative quantitative analyses and allow visualization of various parameters in retinal disease.
Moving forward, developing links with the GIS field shows promise in enhancing ophthalmology research and the clinical management of patients.
We appreciate Jasleen taking the time to speak with us! Special thanks also to Jonathan for providing his workspaces, and images of the inputs and outputs.
If you’d like to learn about the team’s work, here are some resources:
- A Qualitative and Quantitative Assessment of Fundus Autofluorescence Patterns in Patients With Choroideremia
- New imaging methods for quantifying fundus changes in inherited retinal degenerations using spatial manipulation techniques from Geographic Information Systems
- Autofluorescence Measurements in Choroideremia
- A Novel Method for Analysis of Short-Wavelength Autofluorescence Imaging in Rod-Cone Dystrophy
- A Novel Method for Quantitative Serial Autofluorescence Analysis in Retinitis Pigmentosa Using Image Characteristics
- Characterizing the Natural History of Visual Function in Choroideremia Using Microperimetry and Multimodal Retinal Imaging
- Transcorneal electrical stimulation for the treatment of retinitis pigmentosa: results from the TESOLAUK trial
- New: Microperimetry and optical coherence tomography imaging in the fellow eye of patients with unilateral focal ischaemic glaucoma
Editor’s Note: We’ll continue adding to the list above as more resources are published.
The following video provides a summary of the work:
Visual field is an analysis of the amount of side vision a patient has. This is mapped onto paper whilst being tested. These were digitised to create CSVs to get accurate measurements of the volume of visual field seen. FME was used to convert the CSVs into 3D PDF’s that allowed monitoring of the potential treatment.

Erin Lemky
Erin leads the Product Marketing team at Safe Software and enjoys connecting people with the information they need. As a Ravenclaw, she is always seeking knowledge that can help customers improve the world with their innovation. After work, she can be found tending to her permaculture homestead or reading a fantastic adventure with her family.