Today we welcome guest bloggers Henri Veldhuis and Jurgen van Tiggelen from Sweco. They will share what they’ve been able to accomplish in just a few short months, by using FME with Tableau to create map-based visualizations of infrastructure data. Sweco is Europe’s leading architecture and engineering consultancy with over 14,500 employees and projects in over 70 countries worldwide. Sweco has been a Safe Software Partner since 2005.
Sweco has been developing software for the maintenance of infrastructure and terrain for over 20 years. Obsurv system is used by organizations in The Netherlands for making an inventory of their assets (using GIS), for technical inspections and planning, and budgeting for maintenance. Assets which are typically managed with Obsurv include: roads, traffic systems, sewer systems, civil construction or trees and green areas.
Tableau Dashboard for Decision Support
Inspired by a webinar from Safe about preparing mapping data for Tableau, Sweco NL evaluated Tableau and got so enthusiastic about the possibilities that it immediately started using Tableau to create a dashboard. This dashboard supports a municipality’s decision-making process for the budgeting of road maintenance.
Since a budget is rarely sufficient to solve all of the needed maintenance, this dashboard helps Sweco’s clients prioritize the part of the roads where risks are the highest due to the technical condition of the road.
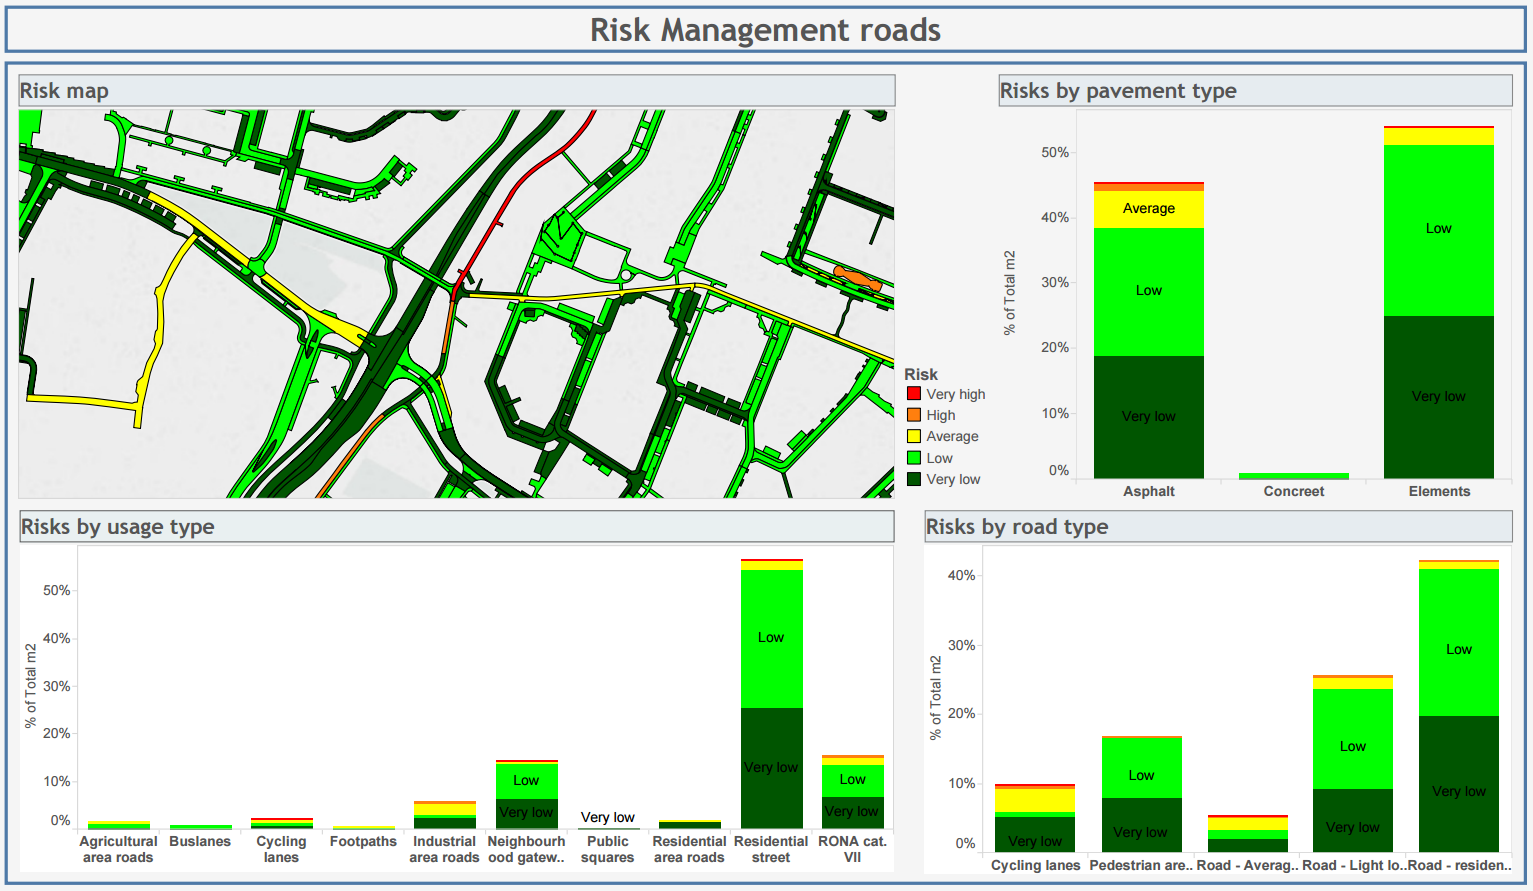
Tableau dashboard with an analysis of risks based on the technical condition of the road.
How the Data Is Prepared for Tableau
Sweco used formulas based on a research performed by Sweco and Twente University in The Netherlands. The original research was performed using calculations in Excel after exporting data from the user interface in Obsurv.
The power of FME is that it provides all the necessary tools to directly perform the calculations and transformations on data extracted from the database itself. Road managers can change their own parameters for the calculations using Excel. This allows them to get the desired output for Tableau directly from FME Server, removing all the additional steps that were needed before.
The SQLCreator and the AttributeManager in particular are powerful transformers for the FME workspace that powers the Tableau dashboards. These transformers provide the best access to all of the required data, and can make all the translations that are normally made in a complex application.
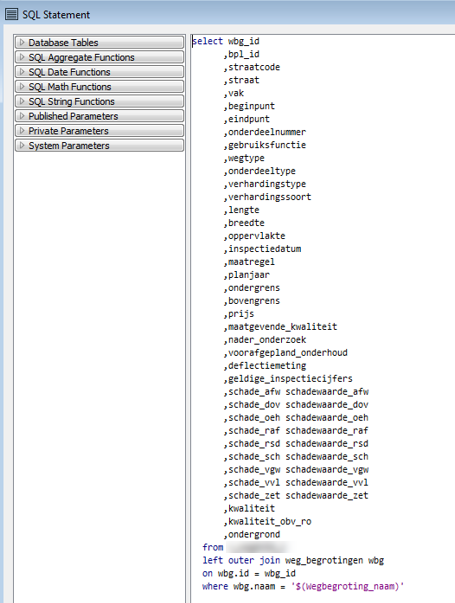
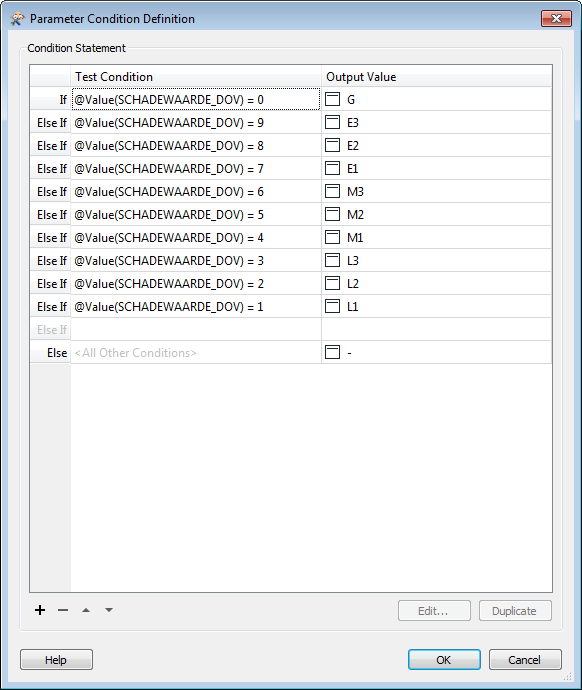
Screenshots of the SQLCreator and AttributeManager transformers used by Sweco.
The SQLCreator allows us to get all the specific data from the database without having to read and join different tables with joiners or mergers. We can directly get the correct and filtered attributes by submitting the correct query.
Due to the fact that that the database works with Foreign keys and values that mostly do not mean anything to the user, we use the AttributeManager to translate the values to meaningful information by using conditional values. This also prevents us from having to read in extra files that would translate these foreign keys to the correct parent code.
When all the translations are made, the rest of the FME workspace is mostly focused on performing all of the calculations. By using arithmetic editor and statistic calculator transformers within FME, all the formulas from the research are able to be used on the data.
Visualizing the Output in Tableau
When this is done, all that’s left is creating the right output for Tableau. We choose Tableau because, in our opinion, it is simply the best tool to create dashboards that are clear and easy for customers to use, with an excellent spatial and non-spatial component.
Most other tools focus on the statistical output without a map. However, in our work-area maps provide very important data. They say: ‘’A picture is worth a thousand words’’, we think a good map can say even more!
See also: Henri demos using the Microsoft HoloLens with Obsurv – watch the video.
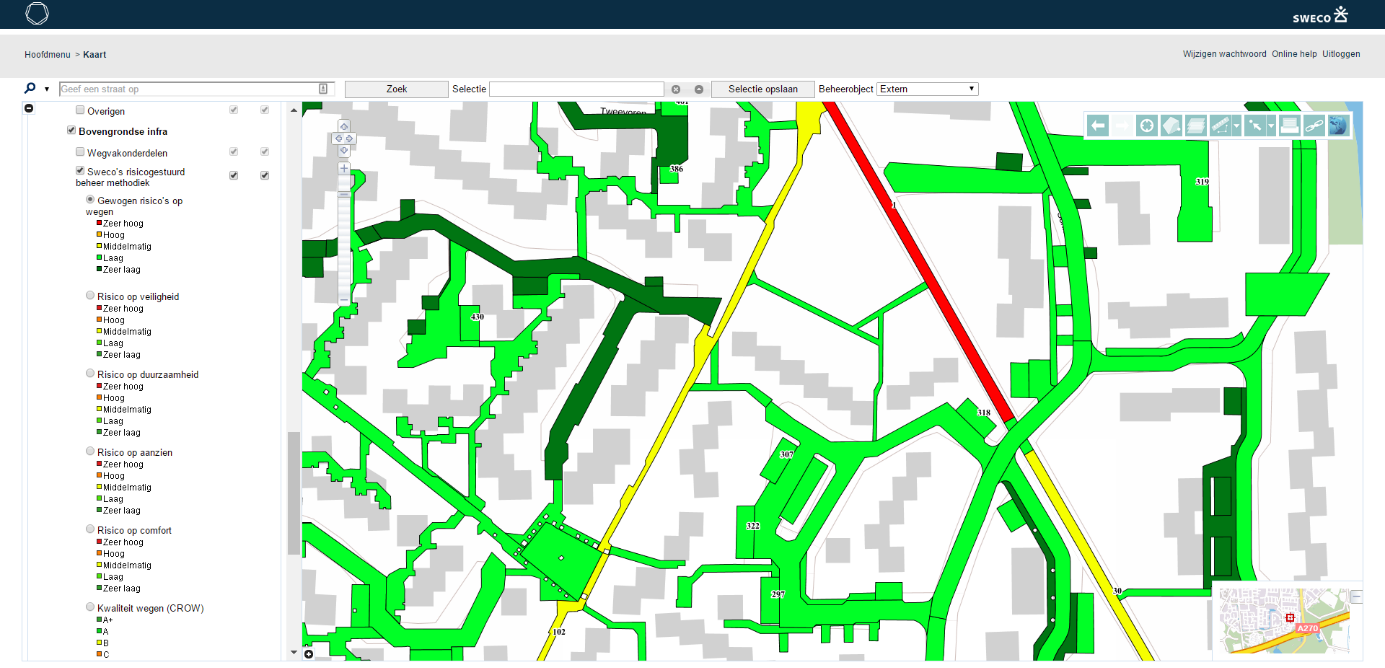
GIS interface Obsurv with the result of the analysis created with FME.
More on Tableau and FME
- Tutorial: Reprojection and Spatial Overlay for Tableau
- Tool: Shapefile to Tableau Free Online File Converter
- Blog: Importing Spatial Data into Tableau using FME
- Webinar: How to Prep Mapping Data for Tableau (Become a Geographic Viz Wiz!)
About the Authors
 |
Henri Veldhuis As Business Development Manager Henri is responsible for creating new business opportunities for Sweco in The Netherlands. He is also responsible for the development of Obsurv in the past and has introduced FME within the Sweco Netherlands organization. Creating simple intuitive software solutions for complex business / engineering requests is what drives him. |
 |
Jurgen van Tiggelen Jurgen van Tiggelen has studied Geomatics and Physical Geography at the Lund University in Sweden. He now works as a software developer and consultant at Sweco in The Netherlands. His expertise lies especially in developing software on the Oracle platform (PL/SQL) and in combination with FME. |

Roger Aikema