Learn how to generate 3D data visualizations that anyone can view in a web browser. Cesium ion support is now in FME 2019.0 beta. Watch our webinar to learn more.
As informative as large 3D models are, sharing them can be a pain. It’s not like you can assume everyone has Revit installed. This is why web visualization libraries like CesiumJS were created. To share your geospatial data with anyone, you just give them a URL, and they can interact with it directly in a web browser. For example:
- Inspect large 3D models, e.g. BIM for architecture, engineering, and construction.
- Plan and review routes for drones, aviation, autonomous driving.
- Explore virtual tours for real estate, urban planning, oil and gas, facilities management.

How FME and Cesium work together. Diagram from the Cesium blog.
By using FME to prepare your data for a Cesium visualization, you get the power to integrate any source datasets and keep the web app up to date.
What is Cesium ion?
Cesium ion is a new SaaS platform that makes it easy to upload, optimize, and stream large datasets in a web browser. Built around CesiumJS, a JavaScript library for visualizing and analyzing 2D and 3D data in a browser, this platform has an advanced 3D tiling pipeline, horizontal scaling abilities, and manages your assets. This makes it a powerful option for hosting and streaming complex 3D datasets.
What’s the difference between Cesium ion, 3D Tiles, and 3D Point Cloud?
If you’re a seasoned FMEer, you might have noticed we already support Cesium in the form of two format writers. So what are these, and how are they different from the new Cesium ion transformer?
- Use FME’s Cesium 3D Tiles Writer to write 3D data into the 3D Tiles format for streaming into a CesiumJS app. Once your data is in the 3D Tiles format, you’ll host it somewhere like S3 and build the JavaScript visualization using the CesiumJS library.
- Use FME’s Cesium 3D Point Cloud Writer to write data as a 3D Tileset with point cloud tiles for streaming into a CesiumJS app. This format is also a Reader, meaning you can read back data in this format for further FME processing.
- Use FME’s CesiumIonConnector transformer (FME 2019+) to push data to Cesium ion and generate a CesiumJS visualization. It outputs a URL. Fun fact: this transformer is the first to be implemented using FME’s new Packages module, which is launching with FME 2019 and will make it easy for our developers to push transformer updates to FME users. Learn more about this in our upcoming webinar and when FME 2019 launches.
Preparing data for visualizing with Cesium
Cesium ion is supported in FME 2019.0+ (download the beta). To send your data to Cesium ion, you’ll need to do a bit of preprocessing in FME to ensure your data is robust, and then convert it into a format accepted by ion. (See also: Uploading assets to Cesium ion tutorial.)
- Integrate your existing data by adding Readers that point to those datasets.
- Add transformers to prepare the data. Some helpful ones: GeometryValidator to detect and repair problems, 3DForcer and Extruder to convert 2D to 3D, AttributeManager to manage the data’s attributes, AppearanceSetter to style the geometry. Browse the transformer gallery and filter by 3D to get an idea of what’s possible.
- Add a FeatureWriter transformer and write the data to a format accepted by Cesium (CityGML, OBJ, LAS, or GeoTIFF).
- Add a CesiumIonConnector and point it to the folder with your converted data. The transformer will send the data inside that folder to Cesium ion.
- The CesiumIonConnector will output a URL to your custom CesiumJS application that streams the asset from ion. At the end of your workflow, add a transformer to log, email, or otherwise take action on the resulting URL.
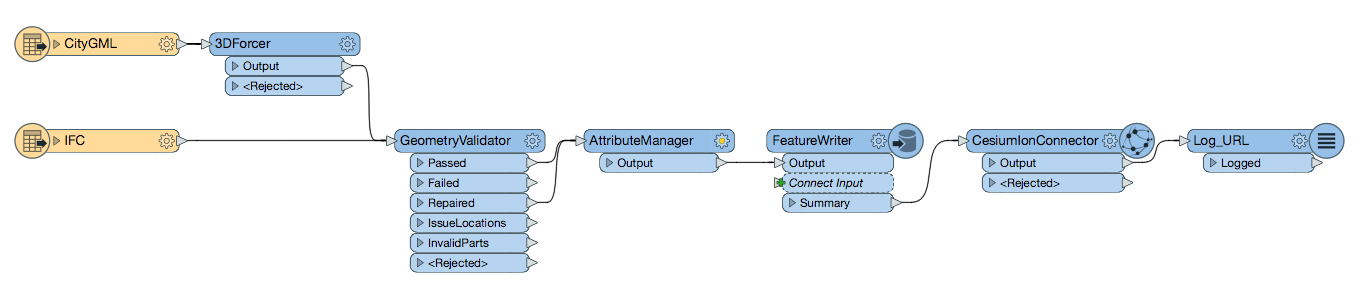
This example FME Workspace integrates disparate data sources, transforms the data into robust 3D objects, pushes it to Cesium ion, and prints the output URL to the FME log window.
You can run the FME Workspace whenever the visualization needs updating, e.g. if the source data changes. If this will be a common task for you, or if you want end users to be able to generate visualizations of Cesium ion assets on demand, publish the workspace to FME Server to set up an event-based workflow to send data to Cesium ion automatically.
Read more about the integration of Cesium and FME on the Cesium blog, and follow their tutorial for a great walkthrough.
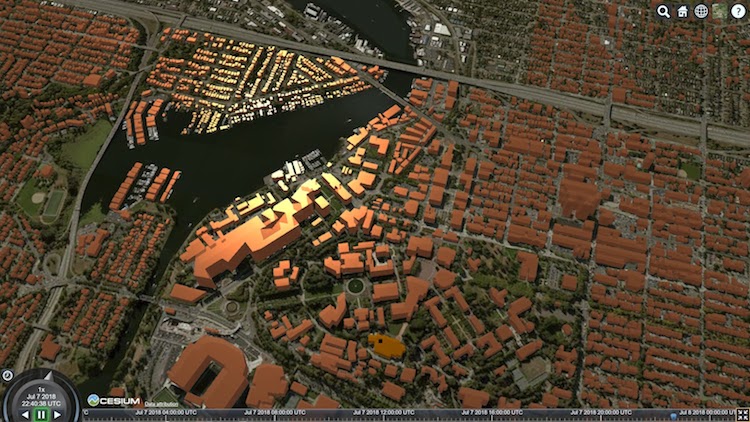
3D buildings transformed from footprints with FME and viewed in a web browser with CesiumJS. [Blog | Slides]
Learn more: Watch the Cesium ion + FME webinar

Tiana Warner
Tiana is a Senior Marketing Specialist at Safe Software. Her background in computer programming and creative hobbies led her to be one of the main producers of creative content for Safe Software. Tiana spends her free time writing fantasy novels, riding her horse, and exploring nature with her rescue pup, Joey.