
5 Excel Tasks You Did Not Know You Could Automate


Microsoft Excel, the industry standard for spreadsheet data, is an increasingly valued skill in the tech world. While many businesses use the application only for basic calculations, graphing, and analysis, others recognize the importance of not only leveraging BI and location intelligence but also spreadsheet automation. Therefore, it is beneficial to learn how to automate Excel spreadsheets to get the most out of your Excel data and Excel tasks.
Spreadsheet automation isn’t one of those life hack lists that’s going to tell you things like “press Ctrl : to insert the current date” (real tip, btw). This is some serious business, like integrating spreadsheets with other data sources, manipulating and analyzing data in ways stretching beyond Excel’s built-in capabilities, and performing tasks that would best be served in a repeated, automated workflow.
5 Excel Tasks You Can Accomplish with Spreadsheet Automation
Here are five powerful tasks you can accomplish with Excel to improve your business intelligence.
 Visualize the spreadsheet as a map
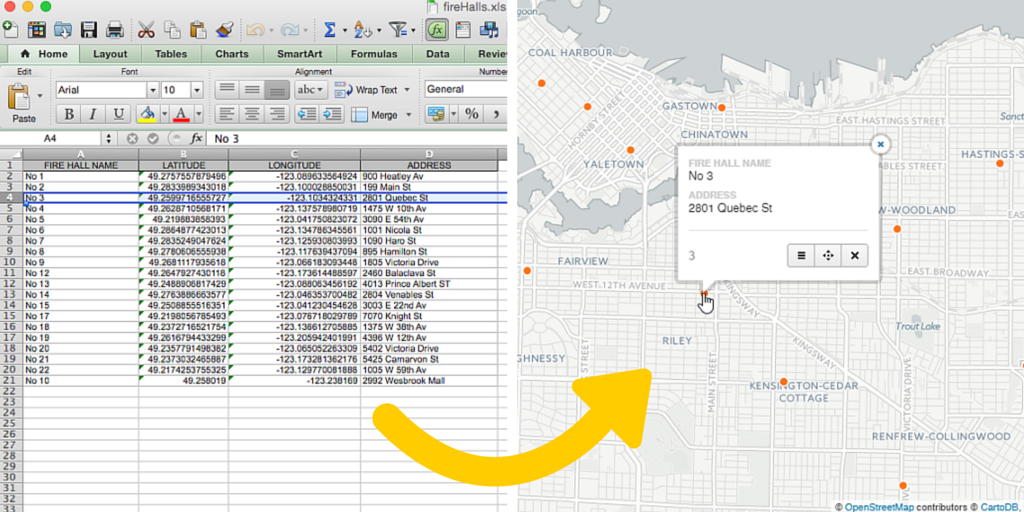
Though Excel data is tabular, it’s common for it to contain location information. By reading the spreadsheet as we would read a spatial dataset, like GML or an Esri Shapefile, we can gain valuable location-based insights and see spatial relationships that would otherwise go undiscovered. A map is worth a thousand spreadsheet rows, my friends.
With FME, tabular data can automatically be made spatial in three ways.
Convert coordinates to geometry
If your spreadsheet data contains X/Y values or Latitude/Longitude, FME automatically converts the rows to geometry. It recognizes common names for geometry columns, like “latitude” and “longitude”, allowing you to instantly visualize a spreadsheet.
Geocode addresses
If your data contains addresses, you can use geocoding to automatically spatialize it. A number of geocoding services can be leveraged in an FME workflow, like ArcGIS Online or Google.
Link to existing geometry
Your spreadsheet might have a column that links to existing geometry stored elsewhere—an ‘Asset Code’ field, a unique ID, even a name. Join the datasets to link the tabular data with the spatial data.
 Merge other data sources with Excel workbooks
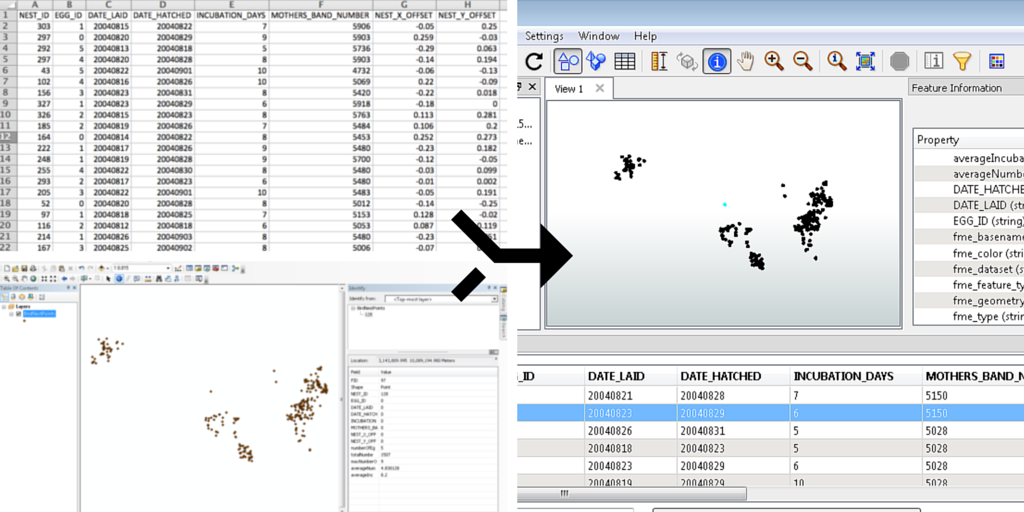
Most businesses store their data in a variety of formats. You might have information in rich and complex spreadsheets, demographic databases, GIS, CAD drawings, web services, maybe even orthophotos.
FME gives you the ability to integrate your spreadsheet with data from hundreds of other formats. By building a workflow, you can automatically import all your data and merge it however you choose. The ability to query any data before generating reports is a huge added value to decision-making and analysis.
Once your Excel data is in an integrated workflow, the possibilities for data transformation, QA, and analysis are virtually endless. For instance:
- apply spatial analysis such as point-on-area overlays
- enrich your data with online services for drive-time areas, routing, geocoding
- perform geometry validation checks
… to name a few.
 Generate reports and summaries in high volumes
Create useful summaries and statistics sheets by transposing or pivoting the data. For example, you can design a workflow that filters the data into different sheets based on the value of a column, then generates a summary report with an analysis of the content. That workflow can be run as many times and as often as you need.
When it comes to repetitive tasks, nothing is more satisfying than having it done automatically while you get on with more important things, like playing Minecraft. That’s the nature of FME: create your workflow once, then use it over and over to do your work for you.
For high volumes, you can automatically generate reports on a schedule, or even set up a self-serve download service where anyone can generate a report on demand.
 Manage and analyze data larger than the Microsoft Excel size limits
Huge datasets can result in poor performance or size restrictions in MS Excel. Thankfully, you can still perform all your analysis and data manipulation outside of Excel. FME’s graphical interface makes working with spreadsheet data intuitive.
You can also create subsets of the large spreadsheet by leveraging pivots and statistics. Cleaning up the data or reformatting the values can also have a big improvement on performance—for instance, by splitting up strings or reformatting date fields.
 Load any data into spreadsheet templates
Much like you can integrate a spreadsheet with data from a variety of disparate sources, you can also merge data to create interesting Excel reports. For instance, you could embed a map or raster image from another source directly into the spreadsheet.
FME offers fine-tuned control over the schema, content, and style of your output spreadsheets. Once you define the styling and formatting—perhaps some combination of predefined pivots, charts, graphs, and images—you can automatically load data into that template at any time. With FME Server, you can automatically run the workspace and update your Excel dataset any time new information is received.
If you’re interested in learning how to perform these powerful tasks with Excel spreadsheets, be sure to join our webinar next week on data reporting and analysis. We also have a recording of our Excel webinar that walks through the scenarios mentioned above. If you’re new to FME, I encourage you to download a free trial and try out FME’s Excel capabilities.
For more information on working with Excel, see our tutorial series, Getting Started with Excel.

How do you use Excel data for business intelligence?
Explore more blog content headline

Data-Driven Marine Operations: 5 Ways to Generate Actionable Insights from Ship to Shore
Introducing FME Form 24.0: Redesigned User Experience for Focus and Consistency


[New!] AI Assist in FME: How to Build Better Data Integration Workflows with the Help of AI