Hi FME’ers,
 I wanted to post one more example of creating HTML reports with FME, because I think it highlights some techniques that I hadn’t mentioned yet, and which I think you’ll find useful.
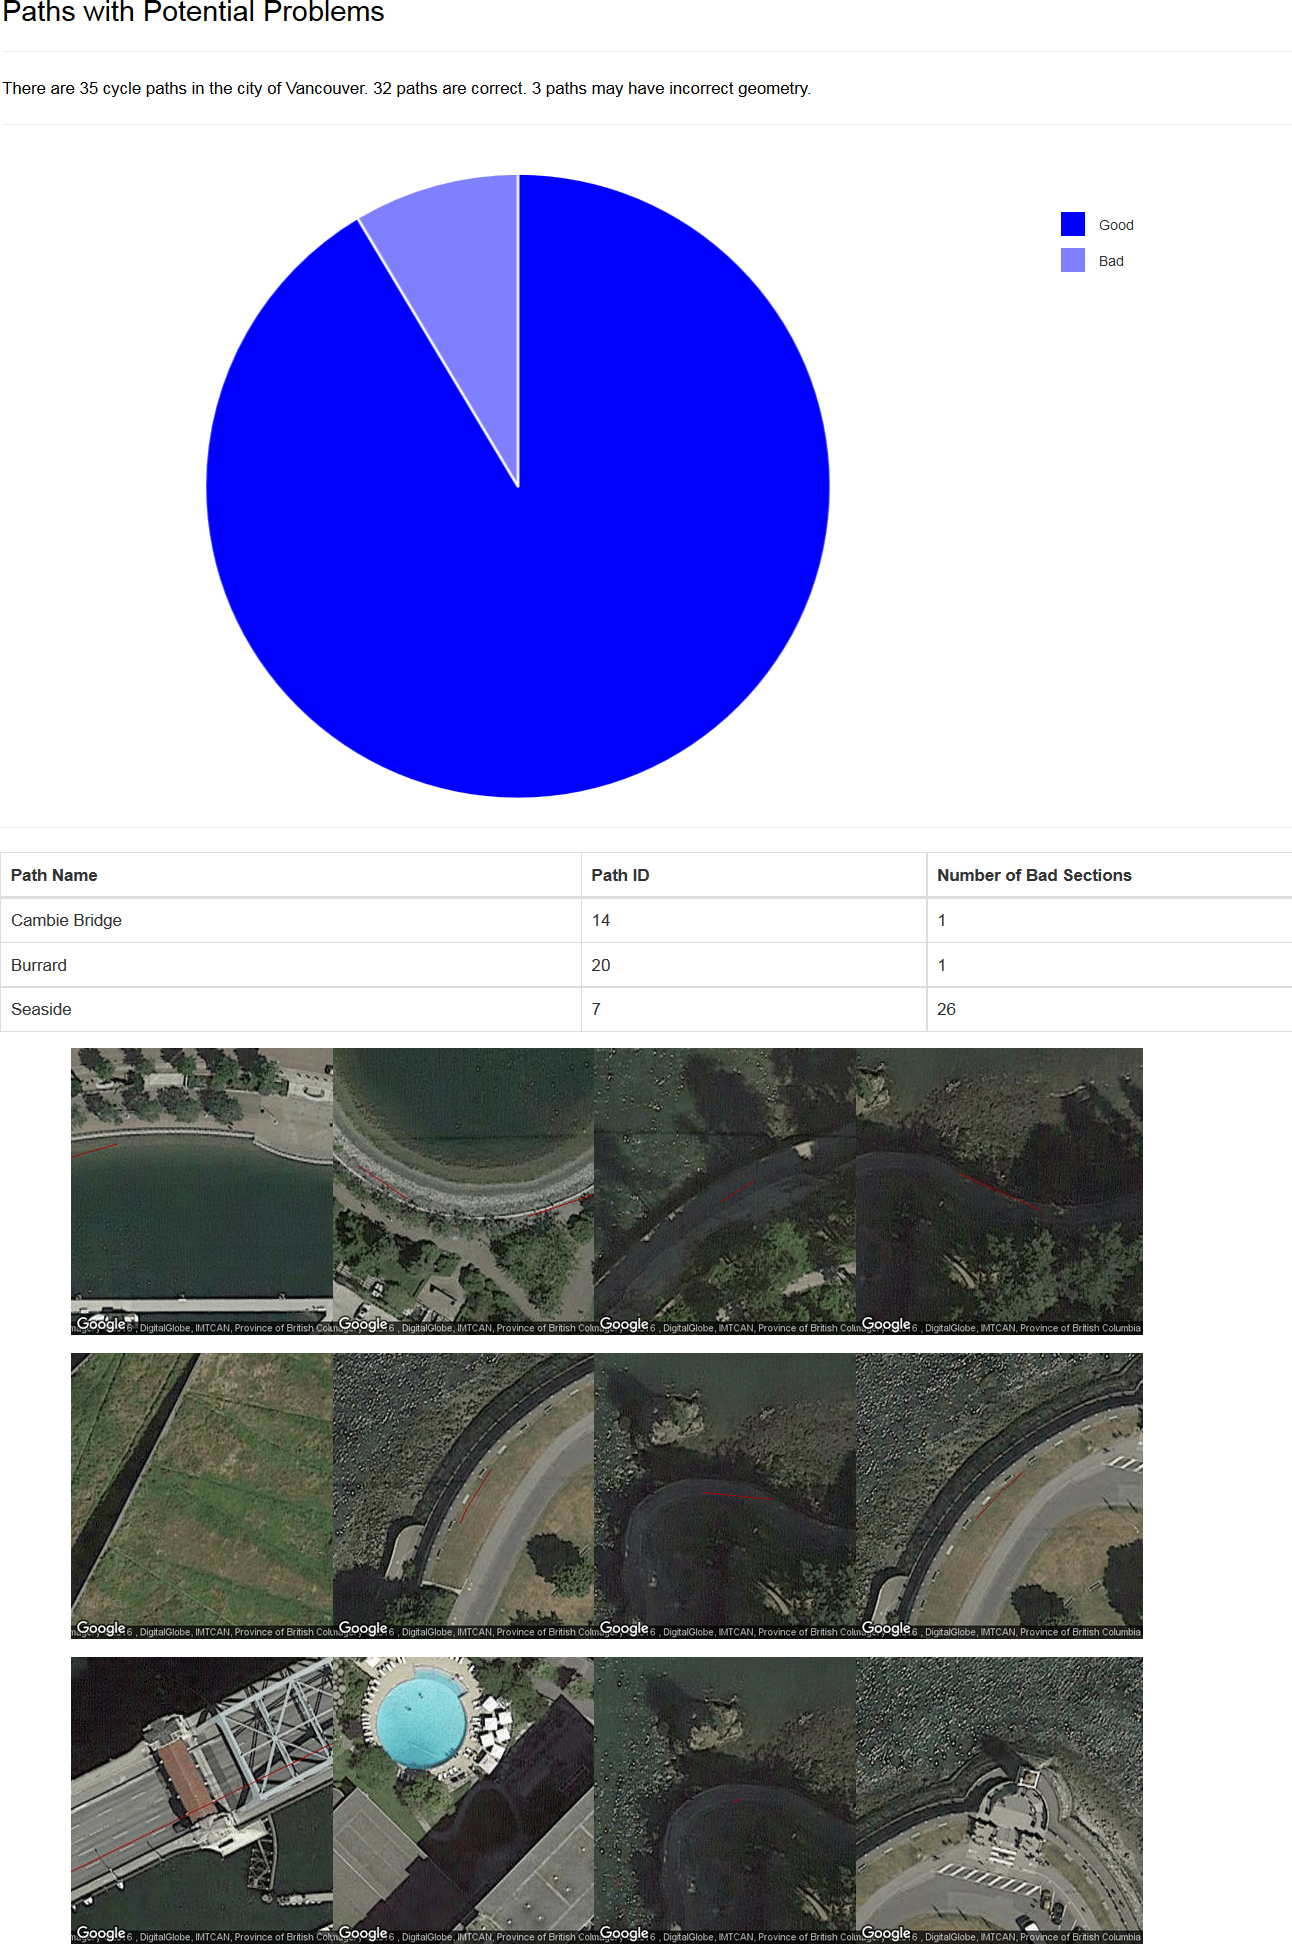
Here I was creating an article for our Data Validation with FME tutorial. The issue being tested for is invalid spatial relationships. In this particular example I’m testing a set of cycle route features. Generally cycle paths don’t run through water(!) so any section that falls outside the Vancouver land boundary dataset is a problem (either with the cycle route or the land boundary).
HTML reports are perfect for data validation, as they can provide a report on the data quality, and the whole thing published to FME Server for a self-serve solution.
In this case the workspace ended up getting a little out of hand – 34 transformers is way past our 10 transformer limit for demos – but I found out some very useful things to know about creating these HTML reports, so here we go…
![]()
The Original Workspace
The original workspace was nice and simple, finding areas of overlap and creating a count of how many cycle paths had problems and how many problems per path:
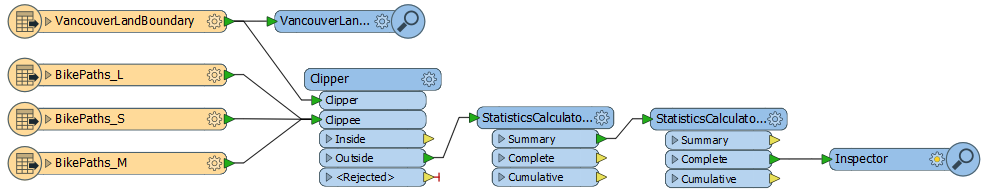
What I get from that is a feature per bad cycle path; in this case three features each with a count of the bad sections and a count of the overall number of bad paths.
What I was aiming for in the report was a list of these bad features, maybe a pie chart, and perhaps even a little map for each bad section. So let’s see how I did that.
![]()
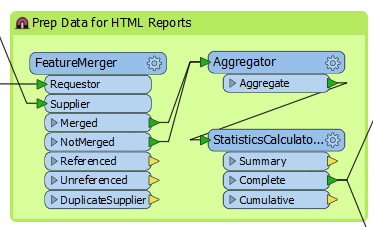
Data Prep and the Basic Report
First steps involved a little data preparation, to merge the statistics onto the original features (FeatureMerger), make sure I have one feature per path (Aggregator) and calculate the total number of paths (StatisticsCalculator). Nothing out of the ordinary so far:
Next I put down a HTMLReportGenerator and tried to create a pie chart. As you’ll know, the steps you take creating a workspace are not the same as the final order of transformers and I had to backtrack a bit. The pie chart doesn’t calculate numbers from incoming data, you need to do that first. Also it needs only one feature per segment of chart. I wanted to show Good vs Bad features (two pie segments), so I needed two features to represent that.
So, tip #1, this is where I found a very useful companion transformer: the Aggregator!
Many HTML report types only need one or two features, like here. The Aggregator is great for pulling all the features together. I could have used a Sampler to get a single feature, but the Aggregator makes sure they have the full set of attributes. Here it ensures that the report feature has both the total number of paths and number of bad features.
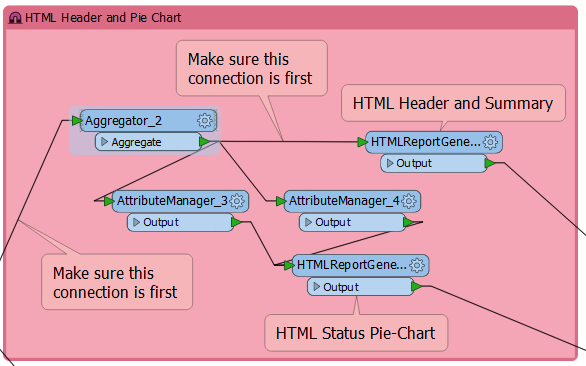
So, the Aggregator provides a single feature to write a report header and summary with this structure:
![]()
The Pie Chart report needs two features, so I simply duplicate the aggregate feature, setting one of them to report the number of good features (with a label) and the other to report the bad ones.
And here we have tip #2: at first I tried to create both header and pie chart in a single HTMLReportGenerator. But the header needed a single feature and the pie chart needed two features. So I eventually recognized that it’s legitimate to have more than one HTMLReportGenerator transformer. In fact I ended up with 4 in this workspace. When you realize that, it becomes much easier.
Notice also the annotation “Make sure this connection is first”. I did that to ensure the header and pie chart were first. But more on that later.
Another section of workspace created a table listing all of the bad features.
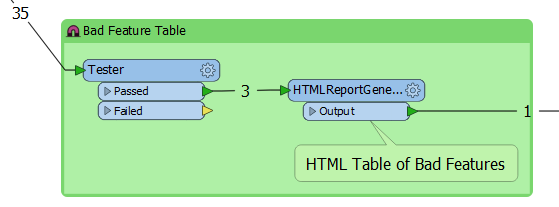
This time we needed three features – one per bad cycle path – so I again used a separate HTMLReportGenerator.
![]()
Maps in a HTML Report
Having created a basic report, I wanted to add a map to visualize the bad sections of data. At first I tried using the Map options in the HTMLReportGenerator, but came up against a few limitations. Firstly you can only have one map per report, and secondly all data pushed into a map report has to use the same color. In my case that meant both land boundary and cycle paths were colored the same, and it became hard to tell which was overlapping which.
So, tip #3, for the moment use the HTML map only for simple data of a single type [we have enhancement requests filed to improve upon this, and I’m sure it will happen soon]. But also remember that the HTMLReportGenerator can use images and that we have a custom transformer called the StaticMapFetcher!
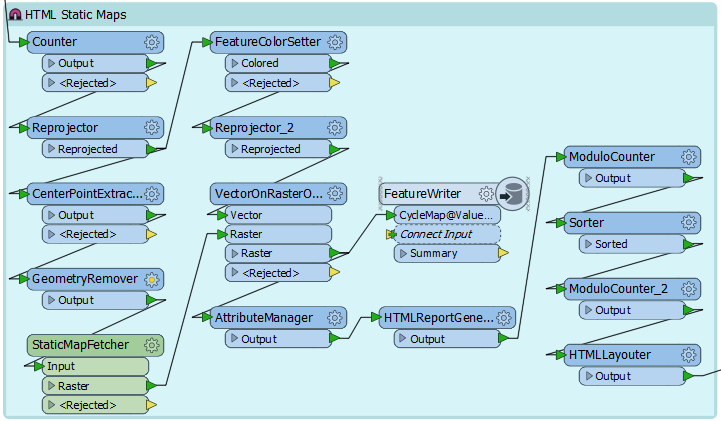
If you wanted to know where most of the transformers in this workspace are, well I think we’ve found them!
However, it has to be said that most of these are a result of the limitations in the StaticMapFetcher custom transformer. I think I will have to do some work on that. To return more than one map I needed to make null geometry features. Features with geometry would be merged into a single map. Also the StaticMapFetcher needs input in LL84 and outputs in SphericalMercator, which adds a couple of Reprojectors on here. Then the vector data is imprinted onto the raster with the VectorOnRasterOverlayer.
Because the HTMLReportGenerator doesn’t accept raster features, I have to write them to files with the FeatureWriter so the HTMLReportGenerator can use them. That adds a few more transformers.
And finally, I want a grid of maps (7 rows, 4 columns) so I used the ModuloCounter/HTMLLayouter trick from my previous blog on this subject.
![]()
Report Order
Previously I’d set connections to fire in a certain order to get the reports in the correct sequence. But here that started to fail. No matter what connection order I set, the maps always came at the top of the report. It’s because the more complex a workspace becomes – with more blocking transformers – the more likely it is that the order of processing won’t be what you expect.
So tip #4 is this: don’t rely on connection order to sort your HTML reports, unless you have a really simple workspace. It’s better to assign an ID number to each report and sort them on that ID:
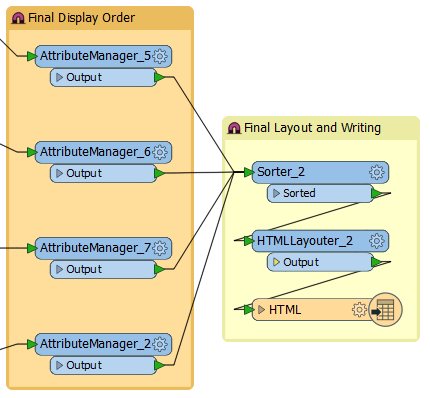
This is the final part of my workspace, and it simply assigns an ID number to each report and sorts by that ID. Then a final HTMLLayouter is there to apply that order. In fact, I’m not even sure that I need that HTMLLayouter, but with it I can be sure my output is correct. Either way we can ignore the “this connection first” annotation, as that’s no longer required.
And that brings me to tip#5: in the same way as the HTMLReportGenerator, it’s legitimate to have more than one HTMLLayouter transformer. In my workspace I have two. The first takes 28 static maps and sets them up as a grid pattern in a single HTML report. The second takes the four reports I have generated and puts them in a plain vertical layout. So not only can I have more than one HTMLLayouter, they can each create separate patterns.
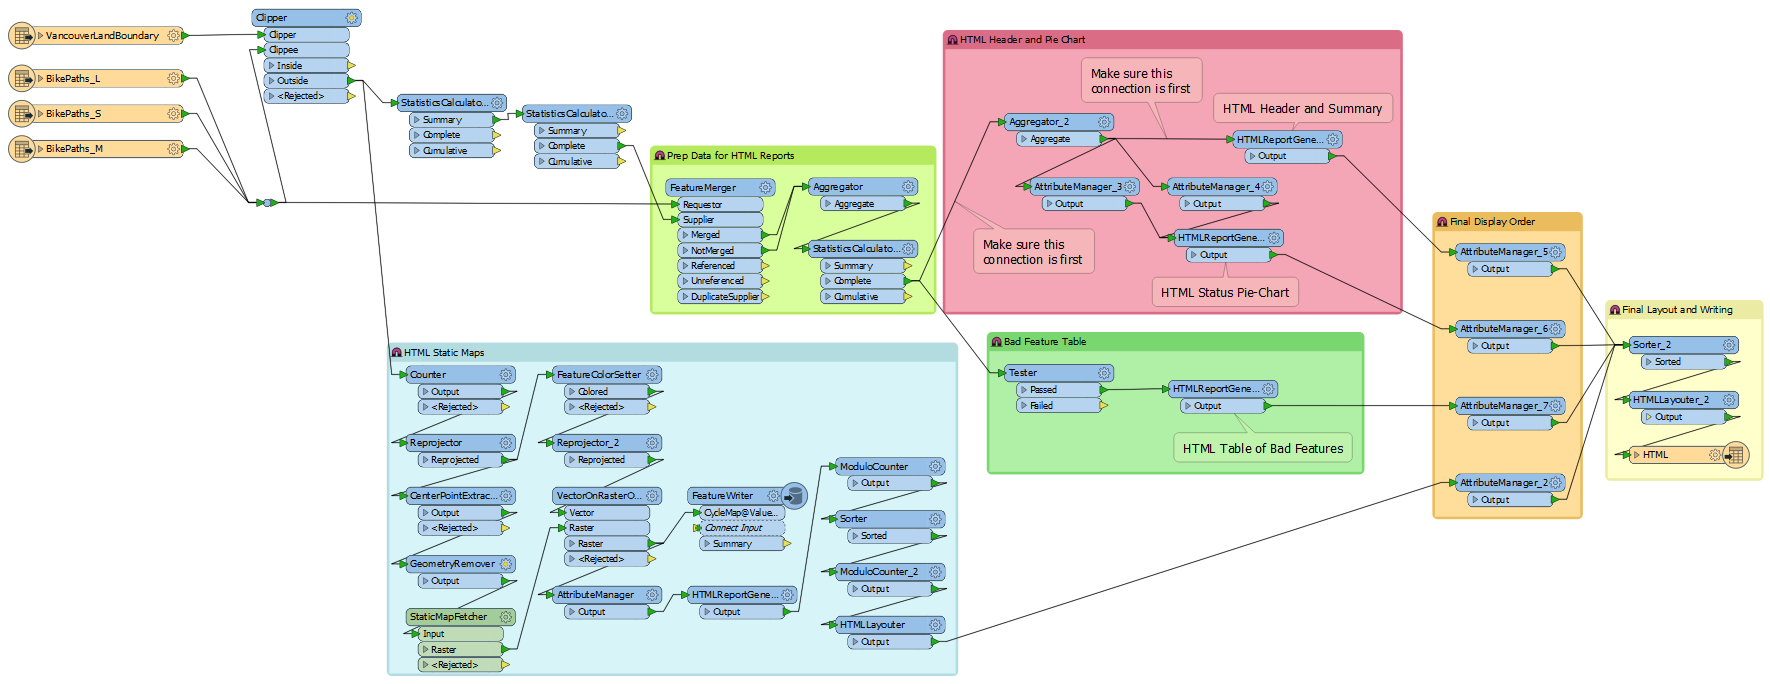
The entire workspace looks like this (click to enlarge):
The final report looks like this (click to enlarge):
If you run this workspace you’ll see from the feature counts how features are turned into reports, which can be merged into larger reports, and so on. Again, once you understand that, the whole process is way easier to use.
![]()
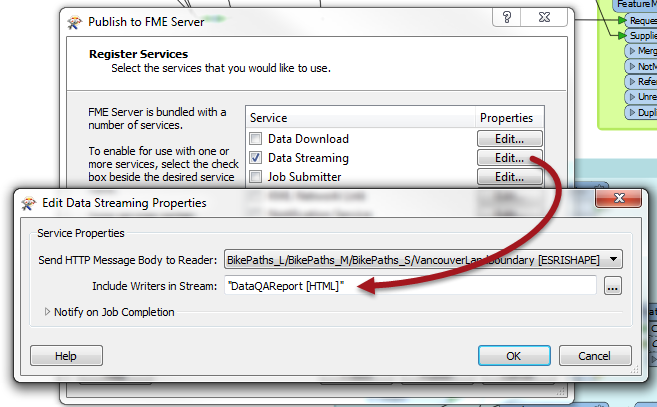
Running on Server
This is very simple to publish to FME Server, but the cool part is where I select Data Streaming as the service to use, and pick the HTML writer to stream:
Then I can go to Server and run the workspace – or run it any other way, for example through the REST API:
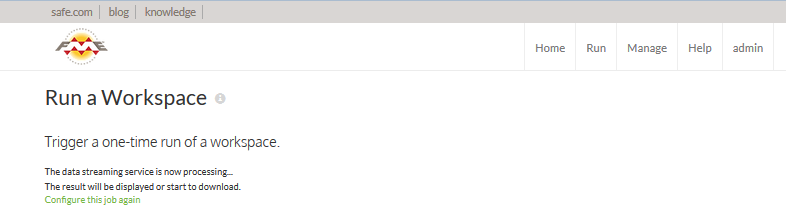
Not only will it run the workspace, but the report will be streamed and output directly in my web browser!
So that’s tip #6: publish a HTMLReportGenerator to Server and you can stream its output directly. It’s great for reporting, but also opens up so many other possibilities besides.
For example, when I run a workspace on Server in Job Submitter mode, the result looks like this:
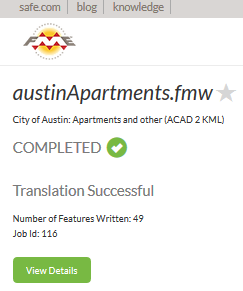
But with this new HTML streaming, there’s no need for that to be the result. You could create your own “workspace completed” HTML response and stream it back to the user! To me it seems especially useful when the user runs the workspace from – for example – a direct URL, because you keep them away from the FME Server interface, like this example:
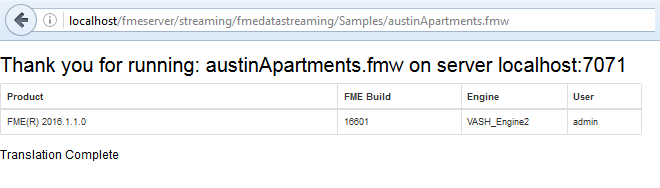
Don’t judge me! I downloaded the workspace, added a HTML writer, and generated that HTML (through the Reporter transformer) in under 5 minutes, so although it’s an example, it’s maybe not a great one! But if I can do that in 5 minutes, just think what an hour or two could produce.
NB: I found you can’t use a system parameter directly in a HTML table report. That’s filed as a problem report and I hope it will be fixed soon.
![]()
Conclusion
I hope you’ve found these posts on HTML reports in FME useful. Personally I think it has a lot of potential – more so that at first appears – and particularly when integrated with FME Server. The transformers are easy to use, with the biggest hurdle being the organization of your data to feed the correct values into them. It was a pleasant surprise to find how well the Aggregator helped there.
If you would like a copy of the above workspace, you can download it from here.


Mark Ireland
Mark, aka iMark, is the FME Evangelist (est. 2004) and has a passion for FME Training. He likes being able to help people understand and use technology in new and interesting ways. One of his other passions is football (aka. Soccer). He likes both technology and soccer so much that he wrote an article about the two together! Who would’ve thought? (Answer: iMark)