It started with a tweet…
@FMEEvangelist @SafeSoftware is there a transformer we can use for finding MinimumSpanningTree within Clusters?Any help would be appreciated
— ipkw (@ipkw) September 8, 2017
I’d never heard of a Minimum Spanning Tree before (it almost sounded like the title character of a folk tale or a children’s book) but the more I investigated the more interesting they were; and I found that others at Safe agreed…
![]()
What is a Minimum Spanning Tree?
My first port of call was Wikipedia, which had this to say:
A minimum spanning tree (MST) or minimum weight spanning tree is a subset of the edges of a connected, edge-weighted undirected graph that connects all the vertices together, without any cycles and with the minimum possible total edge weight. That is, it is a spanning tree whose sum of edge weights is as small as possible.
Luckily they had an image that explained better than words:
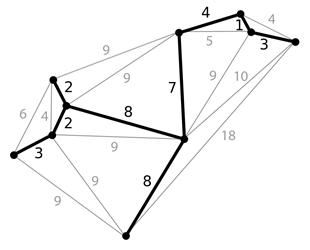
The example they have is to imagine each node on that graph is an address/house. A telecommunications company wishes to lay cable to each house. Which is the least-cost solution?
Incidentally, distance between nodes is the usual cost, but it can include other factors. For example the depth at which a cable needs to be laid could be a factor. In fact there could be several costs like that which go to make up a weight value.
![]()
First Thoughts on a Minimum Spanning Tree in FME
The obvious thought (to me at least) was that the ShortestPathFinder transformer would help, and at first it did seem to work. I took a network of points, generated a TIN as my network and a single path that passed through all nodes as the From-To line:
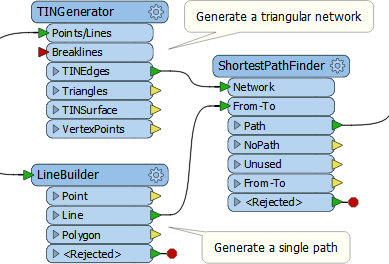
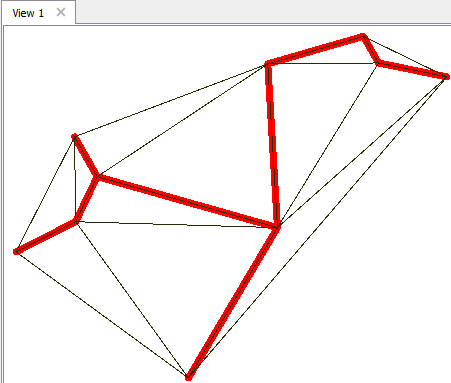
I figured that as long as I allowed the ShortestPathFinder to re-order the node points, and allowed it to do a u-turn back along the same link, then all should be well. The results looked OK, and I was pretty happy, but when I tried my solution against the Wikipedia dataset I got this:
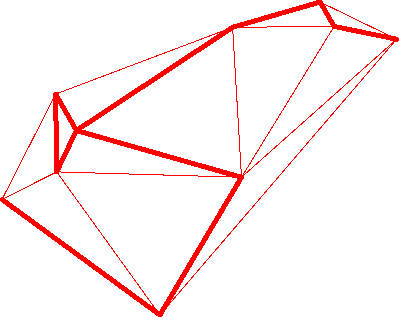
It’s not quite the same, and in hindsight it’s easy to see why:
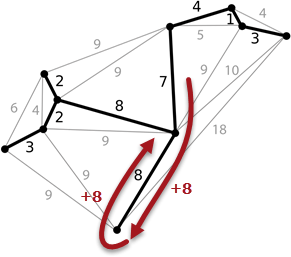
FME can allow a route that does a u-turn, but the cost is counted in both directions! It should only be counted in one direction; for example the telecommunications company’s cables are already two-way. They don’t need to run a cable both there and back. The ShortestPathFinder would never choose the correct solution because it counts that branch as a cost of 16, not 8.
Of course the ShortestPathFinder does have settings to specify the cost of a route forwards and reverse, and in theory I could just say the reverse cost is zero. But “reverse” is related to the direction of the line used, and how do I know which direction it would be used? I would already need to know the result to set up the data to get that result! It just won’t work.
So I was about to give up completely when my colleague Mark Stoakes took up the challenge…
![]()
The “ahh” (or R) moment!
So Mark found a few algorithms to solve the minimum spanning tree problem, but the breakthrough came when he found that R – the statistical computing package – has an MST package. FME already has an RCaller transformer built in, so it just needs R (a free software package) to be downloaded and installed, plus a little bit of simple setting up.
Once you have R installed (v3.4.1 for preference), run the GUI program that comes with it. In there you need to install both the igraph and sqldf packages. That’s very simple; you just type install.packages(“igraph”) and then install.packages(“sqldf”):
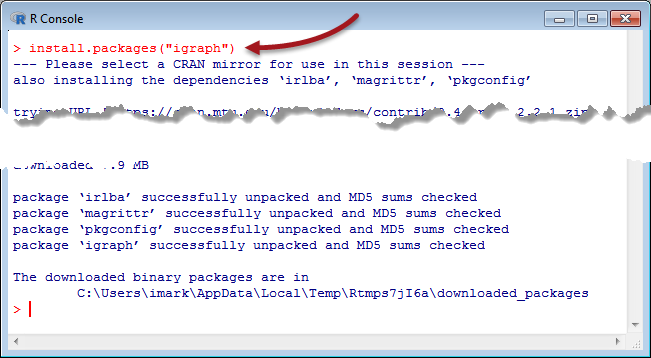
sqldf took a while to install (I thought it had finished, but it hadn’t) but apart from that the process is very painless. Now, back in FME, we open the FME Options dialog and look under “Translation” to find a parameter to point to our newly installed R executable:
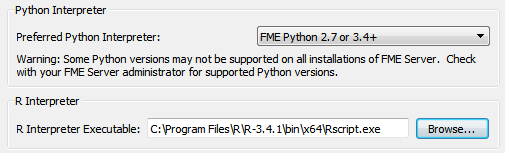
Either the 32-bit or 64-bit versions should be OK.
Now let’s open Mark’s workspace:
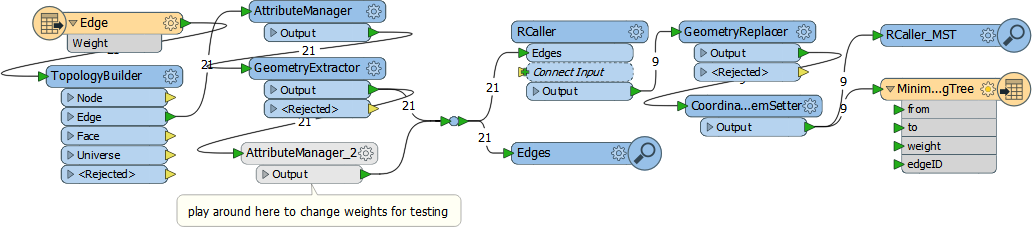
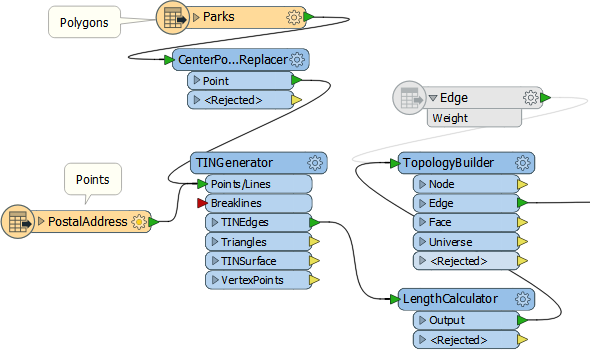
There are ten transformers (including Inspectors and Junctions) so we just sneak into Don’s “maximum 10 transformers” rule. The important ones are:
- TopologyBuilder: Creates the edge attribute needed by the R script
- GeometryExtractor/Replacer: The RCaller outputs the edges as attributes only, so these save and then restore the actual geometry
- RCaller: Obviously runs the R script
The actual R script (shorn of comments) is actually quite short:
library(igraph)
G <- graph_from_data_frame(Edges)
result_mst <- minimum.spanning.tree(G)
result_df <- as_data_frame(result_mst, what="edges")
fmeOutput<-data.frame(result_df)
I don’t know R much (or at all) but it looks like it (1) loads the igraph library, (2) creates a graph of the data, (3) creates the minimum spanning tree from the graph, (4) converts the tree to a data frame, and (5) sends the data back to FME. The result of the workspace is this:
Hurray! That’s exactly what we are looking for!
![]()
Trying it Yourself
OK, let’s say you want to try this yourself; what do you need to do? Well, you can download the workspace for a start. And here are some additions I made to handle other datasets:
Mark is already starting with the Wikipedia dataset’s triangulated model and weight attribute, but if your data is not in the same structure you must do a little work first.
To process polygons you’ll probably want to turn them into points first (CenterPointReplacer). Points are passed into the TINGenerator (set Surface Tolerance = 0) and the TINEdges output taken. That gives us the triangulated model. The LengthCalculator transformer gives a simple weight (cost) to the data. Mark’s data has a Weight attribute already, and if you don’t create the same attribute then there will be a result, but it won’t make much sense. Length is the simplest cost that we can use.
With the Vancouver parks dataset I get this:
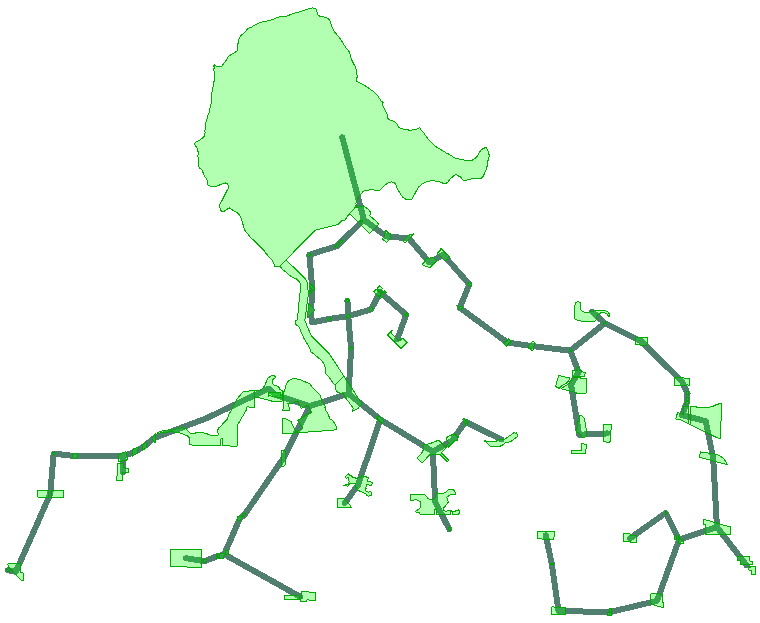
So, if for any strange reason I wanted to water all of the plants in Vancouver parks, with a hose connected to a single tap, this would be my optimum layout!
If I wanted to run cables to every address in Vancouver, this is what it would look like:
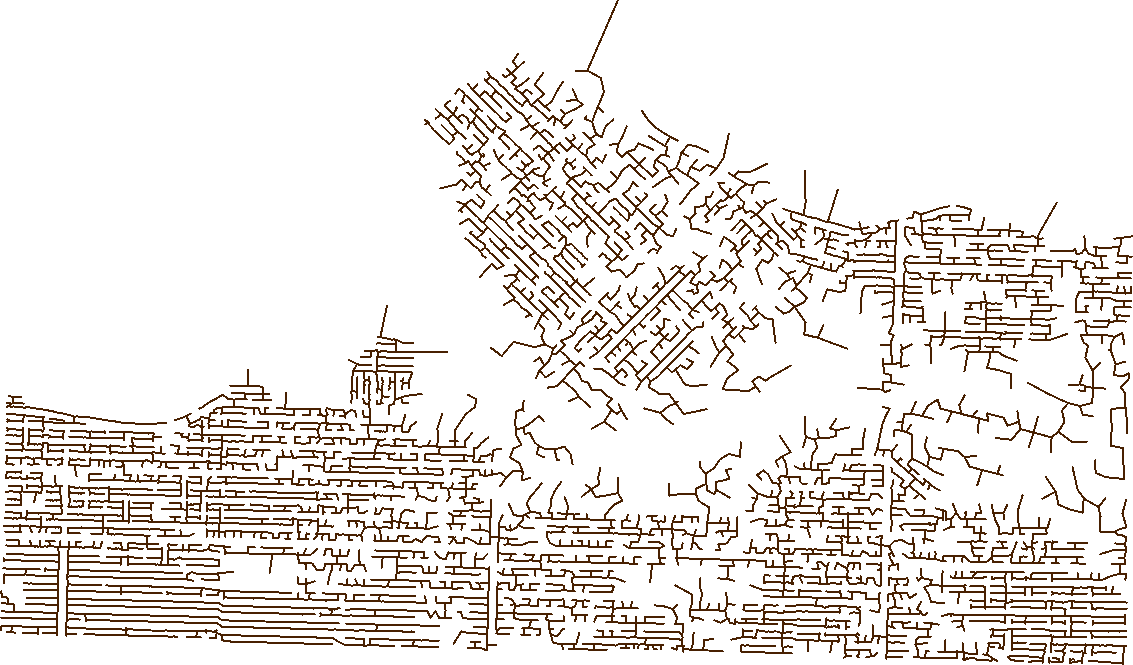
As interesting as that is, the most exciting part for me is that it only took 23 seconds to run! 23 seconds to create a tree for every address in Vancouver! I am very impressed.
![]()
Conclusions
I think there’s three conclusions I can take from this:
- If you want to create minimum spanning trees then this is a good solution – I’m going to try put it on the FME Hub as a custom transformer to make it easier to use
- This is a superb example of why FME is so great at integrations, and why that’s so important. Check out the 62 different transformers in the Integrations category for more evidence of that.
- R is a fantastic tool. I hope I can find time to investigate it some more, and hope that you can check it out too.
If you want to try out R in FME, we have a tutorial on our knowledge base that is a good way to get started.
Cheers


Mark Ireland
Mark, aka iMark, is the FME Evangelist (est. 2004) and has a passion for FME Training. He likes being able to help people understand and use technology in new and interesting ways. One of his other passions is football (aka. Soccer). He likes both technology and soccer so much that he wrote an article about the two together! Who would’ve thought? (Answer: iMark)