Like many people in North America I am a huge NFL fan.
You get the idea.
Those from anywhere else in the world might be getting ready to hit the back button right about now. But I ask you to bear with me for two reasons:
- I was politically correct enough to call it “NFL” and not football, and
- I am going to use my love for NFL to demonstrate some ways to scrape data from the web, prep it and merge it for analysis in an automated way using FME.
To make watching the weekly games more fun, I am part of a weekly pool. It’s pretty straightforward. Each week I pick which teams I believe are going to win and at the end of the week (Thursday to Monday’s games) whoever in the pool gets the most right wins. The prize is pride.
Many factors can influence how a team might do. Weather. Injuries. Are they playing at home? Are they simply better than the other team? I also like to know the lines to give me a crowd-sourced view of what the rest of the NFL world thinks the outcome of the game is going to be.
The Old Way: Manual Scraping + Excel Spreadsheets
Each NFL season I would manually scrape data from different web sources and put it into an Excel spreadsheet so I see all factors together and make an informed decision about my picks. I would spend an hour or so each week cutting and pasting data from different sources. And don’t even get me started about data that was in JSON – that just wasn’t happening.
I decided this was a fool’s game. There had to be a way to click a button each week and have a spreadsheet generated that displayed all of the latest information. Luckily the company I work for (Safe Software) are the creators of the world’s greatest data integration platform (FME).
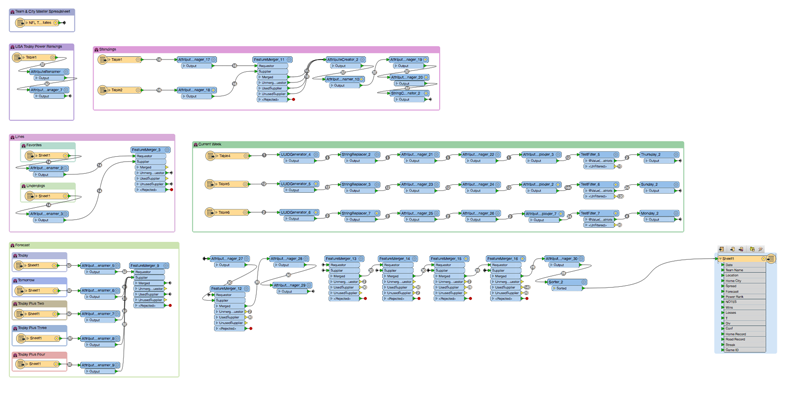
Solution: Automated Data Prep + Merging in FME
My data sources included a static master Excel spreadsheet of team names and cities, a handful of websites’ HTML tables, and a free weather API that gives forecasts in JSON.
Reformatting HTML Table Data
I ran into my first big challenge reading data from an HTML table on a major sports network’s website. The column names were not descriptive and the team name was in a format that wouldn’t allow the information to merge well with other tables. Plus the data was split across two separate tables – one for AFC teams and one for NFC teams.
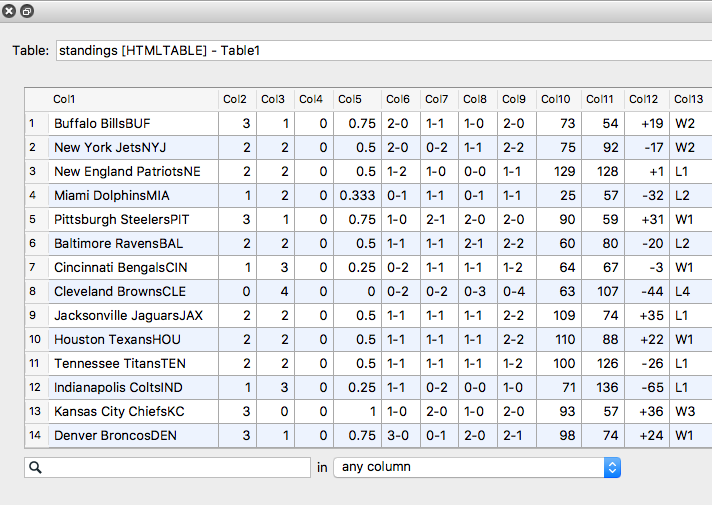
Changing the column names, and merging the two tables was easy enough using the AttributeRenamer and the FeatureMerger. However, reformatting the team names was going to require a bit of creativity.
A little background on how I want each team to be described: because there are cities that have two teams I wanted each to be identified using their commonly used abbreviation. For instance, I wanted the New York Jets to be described as NYJ, and the New York Giants to be described as NYG.
The AttributeSplitter wasn’t going to work as there was no common delimiter. What I did instead was use an AttributeCreator to create an Abbreviation column. The value for each row was calculated using conditional formatting that searched the “Team Name” value for the team’s nickname, i.e. “Giants” and returned their abbreviation.
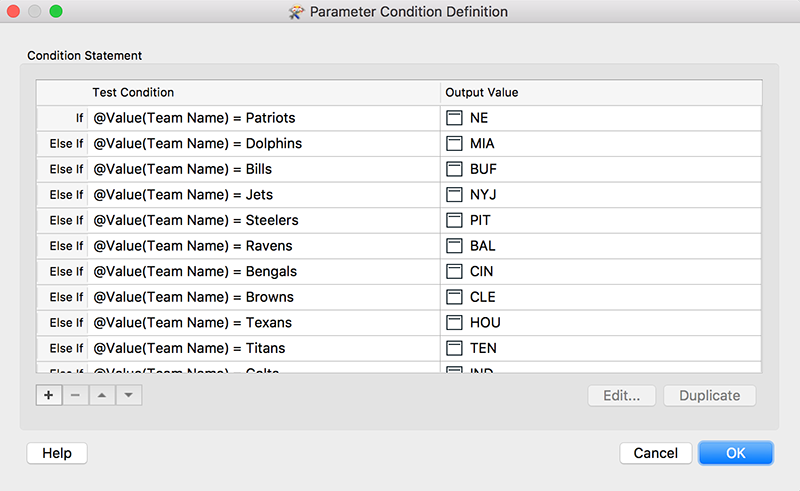
I agree that this is a bit of a manual process entering the conditional formatting rules – but I’ll only have to set this up once and it will continue to work week after week.
“Unpivoting” Data
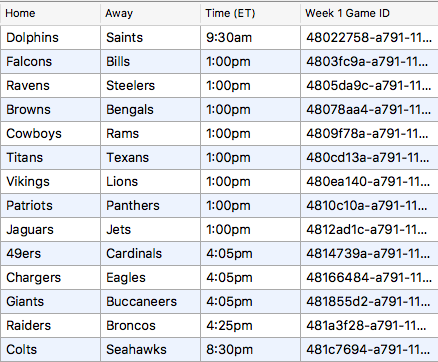
The next HTML table I read data from was for the current week’s matchups.
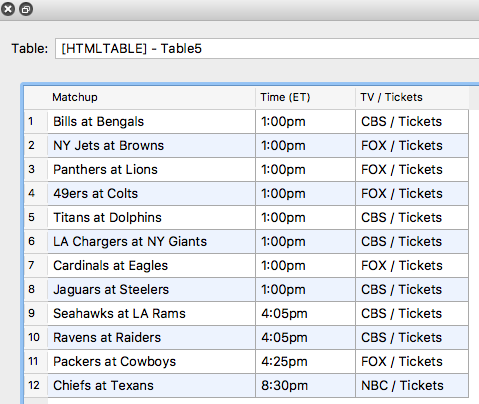
The matchups are merged as a single value and I wanted to split them into two rows, one representing each team in the matchup so I can insert their stats and make a comparison. Before I split them, I used the UUIDGenerator to give each matchup a unique identifier to preserve the matchup pairing.
Splitting the matchup into two rows again required me to access the creative part of my brain, but with FME there is always a way!
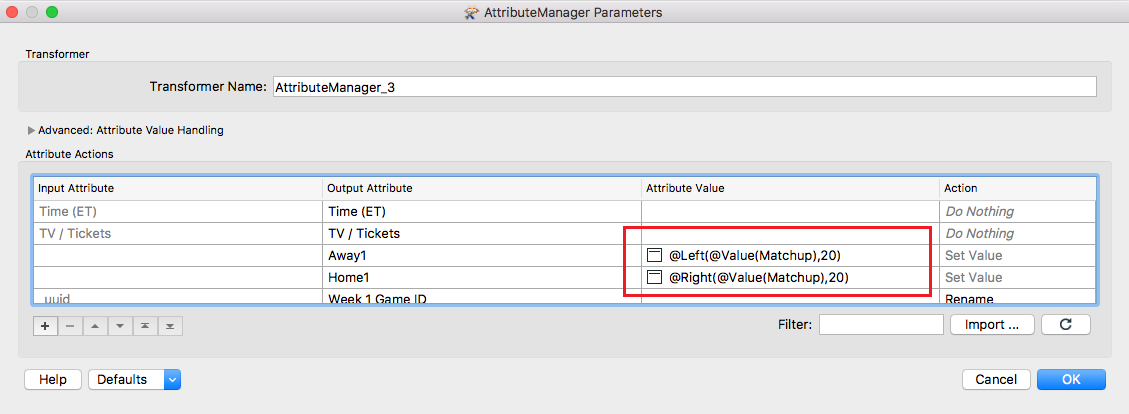
I started by creating a column for each the away and the home teams. I split the matchup column using the StringReplacer to replace the “at” with a very large space. I then created the values for the away and home teams using the trim “left” and “right” functions.
Once again I used conditional formatting to represent each team by its abbreviation. At this point my data looked like this:
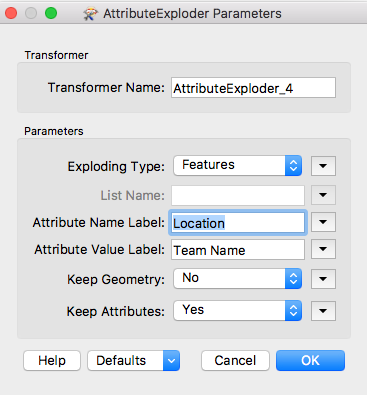
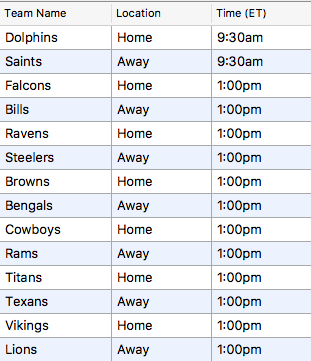
To split each matchup into two rows I used the AttributeExploder to “unpivot” the data.
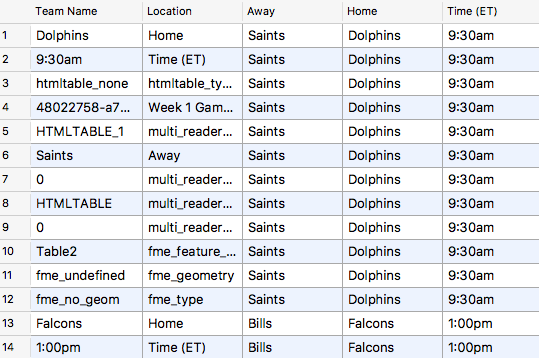
This split the data into two columns: attribute names and values and wrote a row for each name-value pair. I set “Keep Attributes” to “Yes” to keep all other columns. My data now looked like this:
I used conditional formatting in a TestFilter to filter out any features in the Team Name column that didn’t contain an NFL team name and ended up with this:
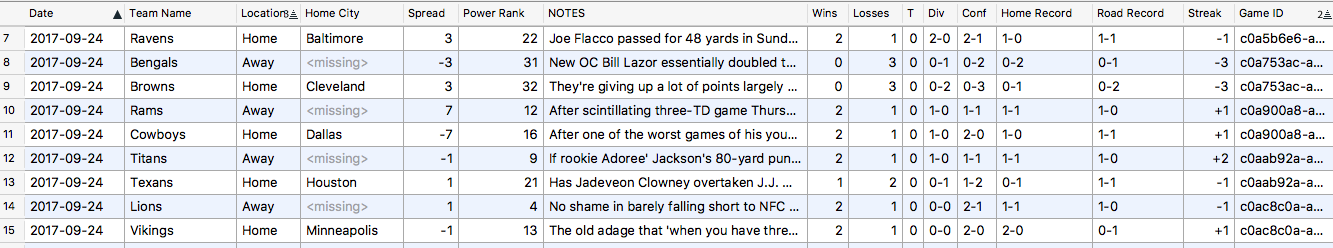
After reformatting some other HTML tables for lines and expert power rankings, I merge them all together to get something like this:
Ughhhhh… JSON
Another thing that’s important for some games (some stadiums are indoor) is the weather forecast. I used a free weather API to grab some JSON on forecasts then merged this with the rest of the data.
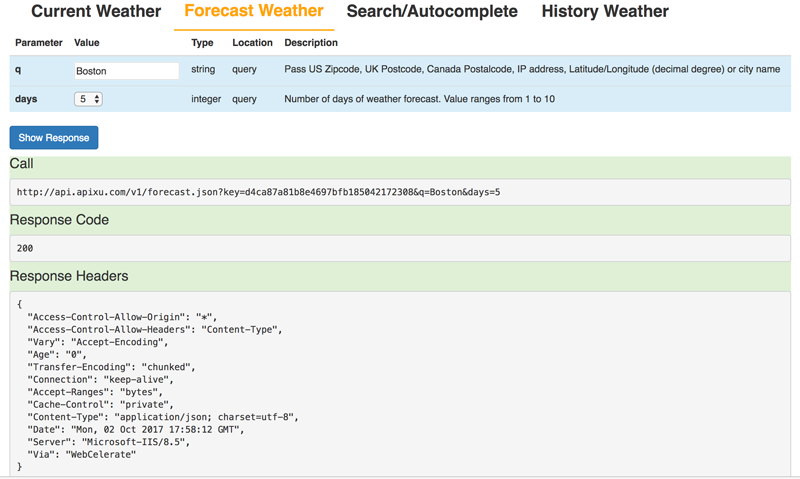
JSON can be a headache to read but FME has tools and capabilities that help alleviate this. Two in particular assisted me in this scenario:
- The HTTPCaller can read a list of URLs as its input. This is extremely helpful as the weather API has a different call for each city. I just created a spreadsheet which lists each city and its corresponding call, read it onto my workspace, connected it to an HTTPCaller and used the column containing the URLs as the “Request URL”.
- The JSONFlattener turns the heavily nested JSON into a table and enables me to expose the values (from the hundreds and hundreds available) that I am interested in – “Conditions – Text”.
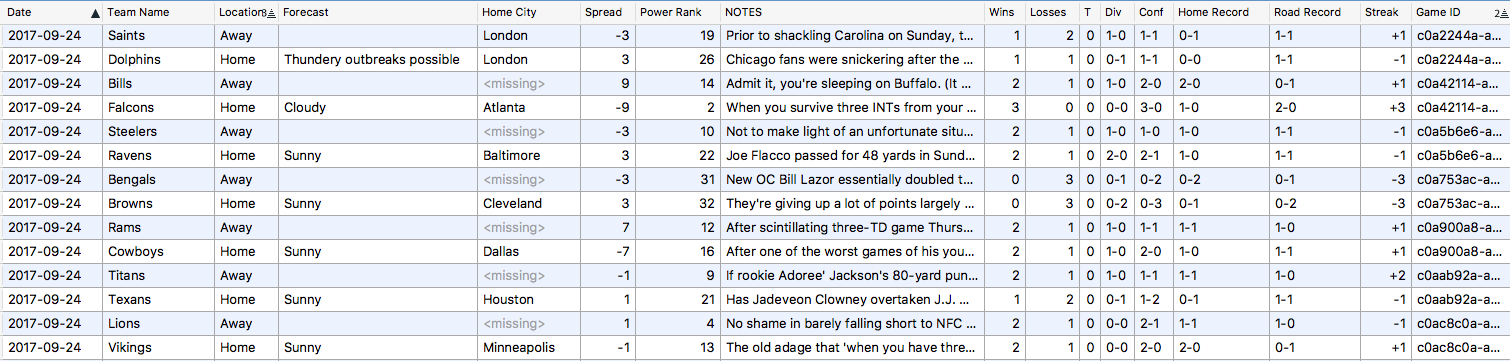
Merging the weather forecasts for cities and days with my other table I now have a column for the home city’s forecast and a spreadsheet that will help me make informed picks for the week.
And through four weeks of the season it’s working! I’m only one game back from the leader.
What I hope I’ve demonstrated with this post is that:
- data from any HTML table can be reformatted to suit your needs with FME’s tools and a little creativity, and
- FME’s automation lets you refresh your spreadsheet of merged data with a click of its little green “run” arrow.
Click here to download my workspaces.

Riley Greene