 This post about creating an FME Hub transformer for spatial sorting was what you call a long-burner, given that I started on the project 18 months ago!
But I persevered and am writing about it here because I think it’s a good example for various FME capabilities: Python scripting, affine warping, custom transformers, the FME Hub, and – perhaps most of all – a solution to sorting data by spatial location.
![]()
Part 1: Down the Rabbit Hole
Because this project began so long ago, I can’t even remember why I did start. It might have been part of a knowledgebase challenge that I was considering but, in short, the idea was to build an FME method for creating a Hilbert Curve.
A Hilbert Curve – and because I’m not a mathematician my description may be a little off – is a continuous line, with a fractal shape, that can be used to fill a given area. It looks like this:

 I started off using a Python script to generate this (more info to follow) and, needing some help with arrays, asked a question on our knowledgebase. I got the help I needed, but a fellow GIS expert (Bruce Harold) suggested that creating curves like this for spatial indexing was sending me “off down a wormhole”.
In one sense he was wrong. A wormhole is a theoretical method of taking a shortcut to complete a journey faster than the speed of light; and I certainly didn’t reach my goal at that speed! What I think he meant was “down a rabbit hole”, which is a reference to Alice’s Adventures in Wonderland and means embarking on an adventure that’s full of complexity and unexpected events.
In that sense he was 100% correct and, since Hilbert Curves were a solution without a problem, I wasn’t really interested in taking that journey. But I forgot that something always happens to make you reconsider…
![]()
Part 2: The Pool of Tears
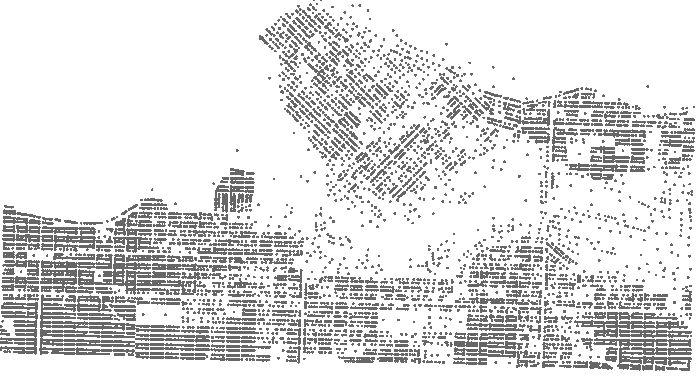
This question on the knowledge centre is one that appears fairly often in various forms. The user wishes to simply create groups of data. In this case they need to create a series of polygons that each contain one hundred (100) buildings; for example these address points in Vancouver might be our starting point:
It’s fairly simple to just pick 100 addresses at a time; the problem comes when we need to draw polygons around them. If the addresses are sorted by a non-spatial attribute such as creation date, or worse still not sorted in any order, then there’s no guarantee that the addresses will form tight polygons. For example, here’s a polygon that covers the first 100 addresses:
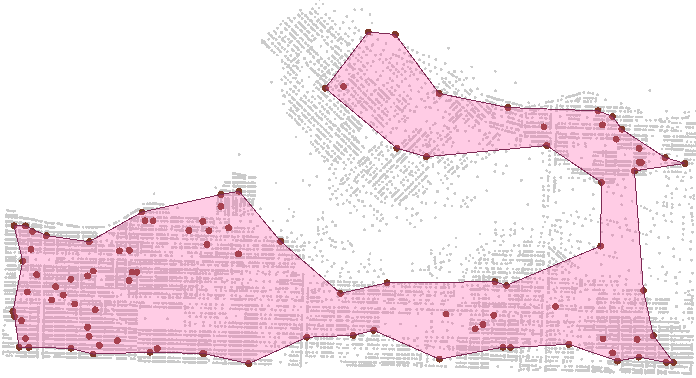
This is not, I think, what the user was looking for!
The only way to get polygons that encompass 100 addresses close to each other, is to sort the data spatially. It so happens that a property of the Hilbert Curve is that the closer two points exist along the curve, the closer their x/y coordinates are, and so I figured that I could sort addresses spatially by testing their position on a curve.
![]()
Part 3: A Mad Tea Party
So, here’s the custom transformer I created. As you can see, it’s certainly more than ten transformers (click to enlarge):
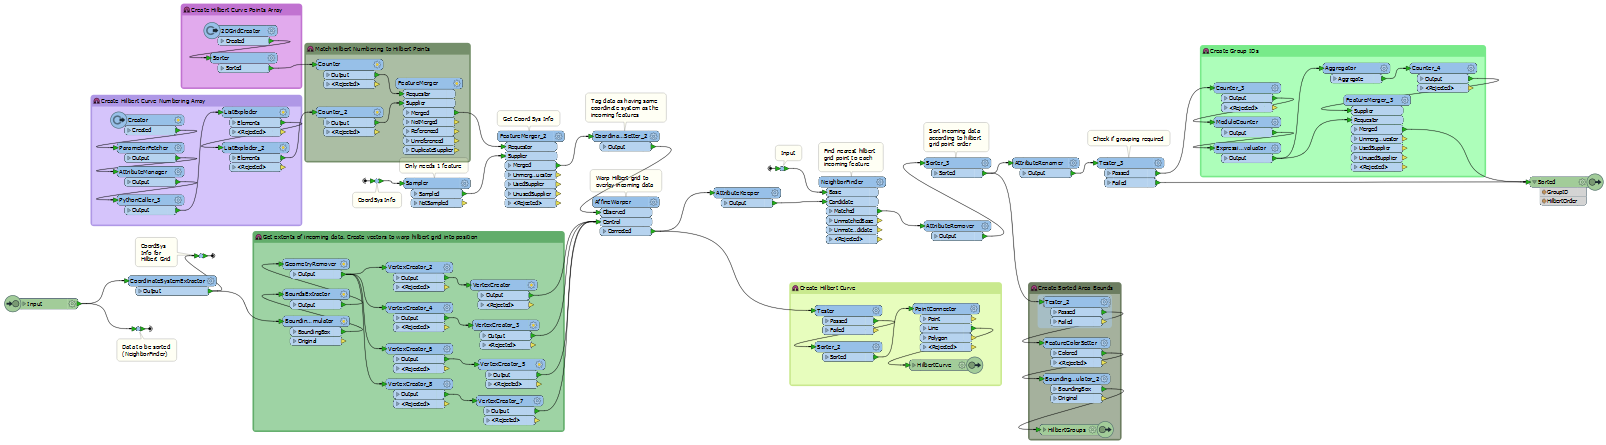
I won’t explain the workspace down to the nuts and bolts, because it would take too long and not be that interesting. But in general…
3a: The Python
I looked for a Python script that generated a Hilbert Curve. There were plenty, but I settled on this little script:
def hilbert_curve(n):
    ''' Generate Hilbert curve indexing for (n, n) array. 'n' must be a power of two. '''
    # recursion base
    if n == 1:
        return numpy.zeros((1, 1), int32)
    # make (n/2, n/2) index
    t = hilbert_curve(n//2)
    # flip it four times and add index offsets
    a = flipud(rot90(t))
    b = t + t.size
    c = t + t.size*2
    d = flipud(rot90(t, -1)) + t.size*3
    # and stack four tiles into resulting array
    return vstack(map(hstack, [[a, b], [d, c]]))
Most of the Python I saw generated graphics, and I didn’t need that. FME can do that for me. That script just generates an array of values that describe the curve. All I have to do is explode that array into an FME list, like so:
def processFeature(feature):
    curvenum = feature.getAttribute('SortPrecision')
    for i, s in enumerate(hilbert_curve(curvenum)):
        for j, v in enumerate(s):
            feature.setAttribute('_list2{%d}.sub{%d}' % (i, j), int(v))
    pass
Now I can use that FME list to make geometry…
3b: The Curve
To set up the curve as a spatial feature I have this bit of workspace:
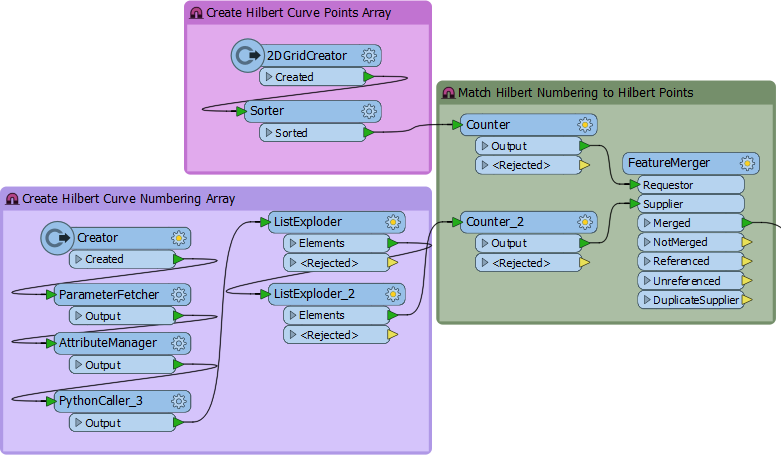
Basically I create a grid of points that matches the array used in the Python script, so if n in my function is 64, I create a 64×64 array of points. Then I merge the point order from the list onto the point features.
Finally (not shown above) all I need to do is use Sorter and LineBuilder transformers to create my curve. So if all you want is a pretty fractal shape in your Data Inspector, then you just need to use that bit of workspace. To sort your actual data spatially requires a little more effort…
3c: The AffineWarper
To sort source features they need matching to the generated curve. But that’s no use if the curve is not in the same coordinate space. So firstly I warp the curve onto the source data extents:
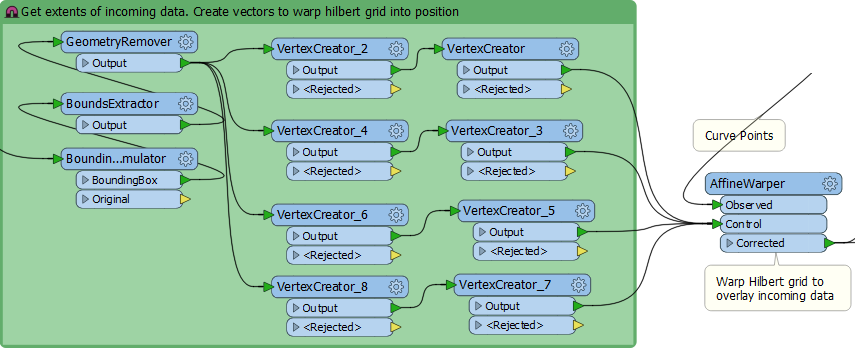
If you’ve never used the AffineWarper it’s a nifty little transformer that lets you move data when (for example) it has no coordinate system but you can match several points to known locations. Here I take the extents of the incoming data, generate control features (lines that point from curve to the known location), and then warp it with the AffineWarper.
I’ve done similar things where I have a fixed map frame, and want to warp my data into it for output to a PDF map. Anyway, now the curve is overlaid on my source data I can determine which part of the curve each feature is closest to…
3d: The NeighborFinder
I find the nearest vertex on the curve to each feature, and give the features the ID number of that vertex, with a NeighborFinder transformer:
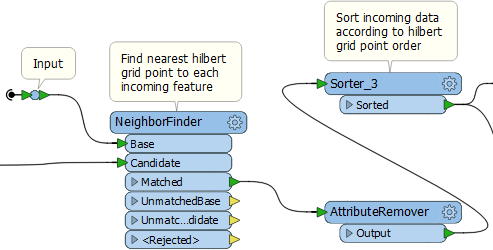
Sort the features by the ID number and we have spatially sorted data!
The rest of the transformer just deals with different options for the output. For example you get to choose whether to output:
- Just the data after sorting
- The curve that was generated
- A bounding box that encompasses features matched to the same curve vertex
- A group ID number
The group ID number solves the initial problem mentioned above. By setting its value to 100, I can group addresses into batches of 100. If I throw a hull around the groups I get something like this:
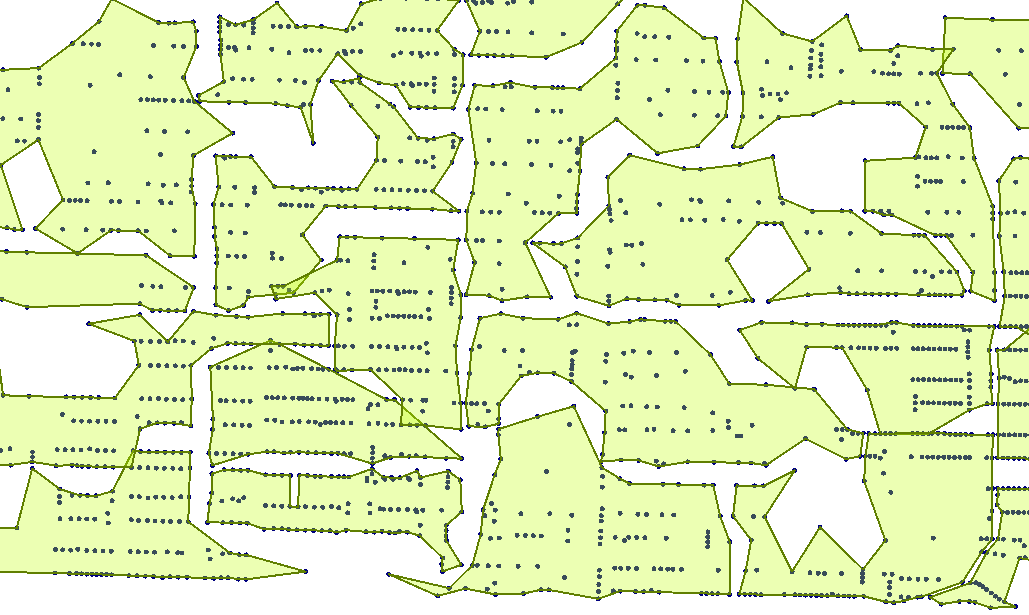
A couple of small overlaps, but that’s mostly due to the hull algorithm. In general the sorting gave us groups of addresses that occupy spatially unique areas.
If, for example, I have a number of teams who need to visit these addresses (say I’m in charge of organizing mail delivery routes) I can assign a group to each team and minimize travel. In fact, I could now use the ShortestPathFinder transformer to identify a route to follow to visit addresses in each group. Nice!
![]()
Part 4: Alice’s Evidence
 OK, so I jumped into the rabbit hole but managed to emerge with something that’s a reasonable project. What’s the important point that helped me do that?
Well, I used Python in a way that enhanced FME. I often see people (and I’m talking about GIS in general, not just FME) whose first instinct is to code a solution to everything, and then to tell everyone that you must be a coder to work in the GIS industry.
I think it’s better to use the predefined tools available, but to be aware of when it’s appropriate to extend them with a little script or two. I’d like to think this is a good example. I escaped the rabbit hole because I knew where I would need to strengthen FME with a little coding, to create a good hybrid solution.
So I don’t say, “No Python”, rather use Python in its right place.
![]()
Conclusion
I hope you found this little trip into wonderland interesting. It was fun for me and after creating this transformer I uploaded it to the FME Hub, which is where you can find it if you would like to explore it some more or even use it to sort your data.
And if you are thinking about fun projects of your own, don’t forget we’re now running the FME Holiday Hackathon, with some great prizes for the best project as voted for by our users.

PS: I gratefully acknowledge the help given to me by FME enthusiast Takashi. It was an honour to meet you at the user conference and I am totally in awe of your Python skills! A plain “thank you” just isn’t enough for what you do.

Mark Ireland
Mark, aka iMark, is the FME Evangelist (est. 2004) and has a passion for FME Training. He likes being able to help people understand and use technology in new and interesting ways. One of his other passions is football (aka. Soccer). He likes both technology and soccer so much that he wrote an article about the two together! Who would’ve thought? (Answer: iMark)