The Sigogne GIS-Web Portal provides data on flora and fauna in Franche-Comté, France. Here is how they use FME to calculate and visualize biodiversity in the area. Sigogne presented at the FME World Tour 2017 in France. Register for the FME World Tour 2018 to learn more about their story.
Pop quiz: how do scientists approximate the number of species in an area?
They use statistical estimators — which estimates quantity based on observed data — to produce those numbers with high accuracy. People still need to go into the field and count the number of species they observe, but it’s more efficient to estimate the total number based on the small observed sample.
Sigogne, a French organization, was able to harness the power of FME with the help of the RCaller transformer to crunch the numbers. The RCaller transformer executes an R script within FME using a temporary data frame. After testing a variety of non-parametric species estimators, they settled on using the Jackknife and Chao estimators for this problem. These estimators are similar in that they identify biodiversity by taking the occurrence of the species into account; this is useful because it can also determine the rarity of a species. Although the statistical formula for these estimators is complicated, R has built-in functions for both the Jackknife and Chao estimators. If you are interested in learning more about the statistical details for each of these estimators you can read the article put out by Palaeontologia Electronica.
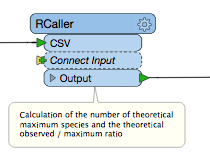
Using the RCaller. [See documentation]
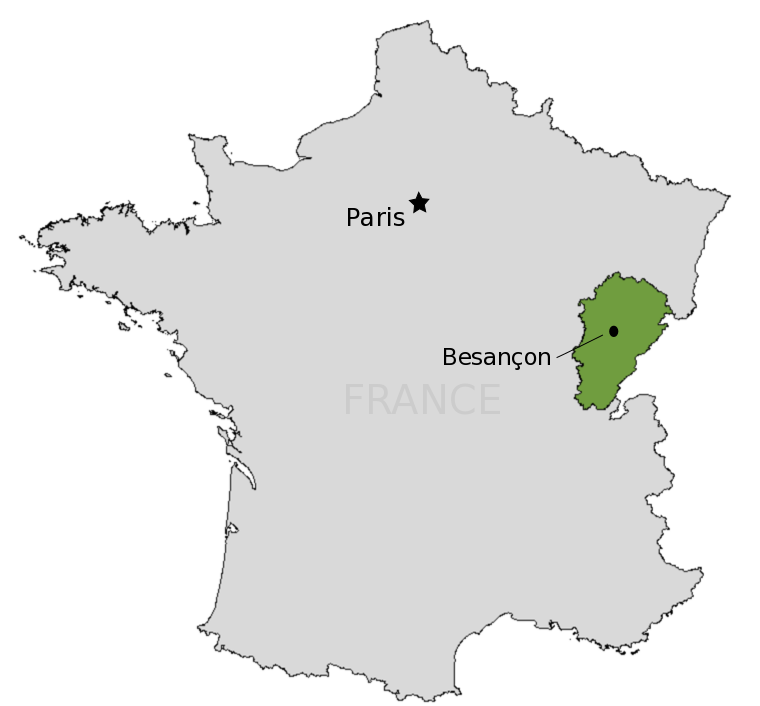
The central area of study for this project was the Franche-Comté region of France, which borders Switzerland. The overall project looked at different types of flora and fauna, but for their FME World Tour 2017 presentation, they focused on only breeding bird populations. They also randomly selected eight sample communes to demonstrate the workspace containing the RCaller.
Visualizing Estimations of Biodiversity
The demo workspace produces 167 1 km2 areas each containing data about the number of species in that area. The number of observed species is then extruded to create a visual representation of the numbers. This map is produced using a combination of ExpressionEvaluator transformers and an Extruder transformer.
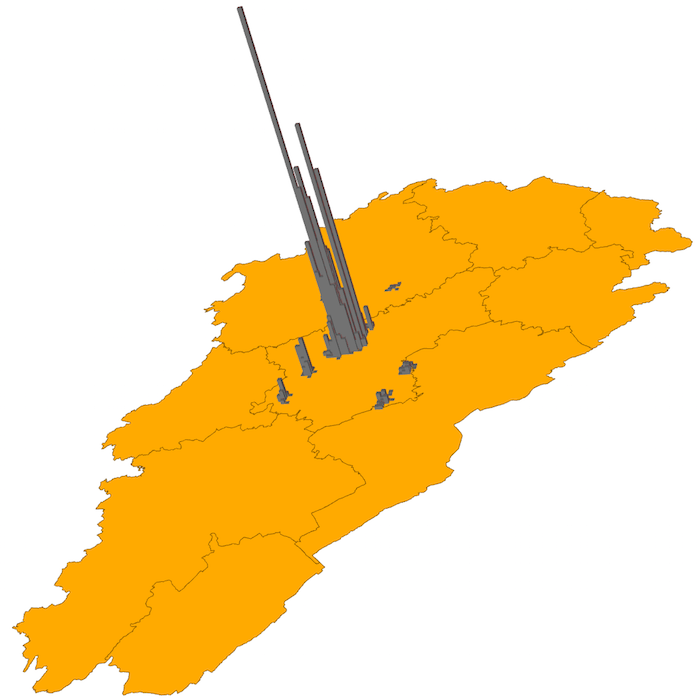
Number of observed species in 8 areas of France-Comté
When running the script with the entirety of the data for breeding birds, the data shows areas with a good index and a bad index. These areas with bad indices indicate where more species observation is required. This information can be useful for determining human impact, environmental factors and changes in population, if done regularly.
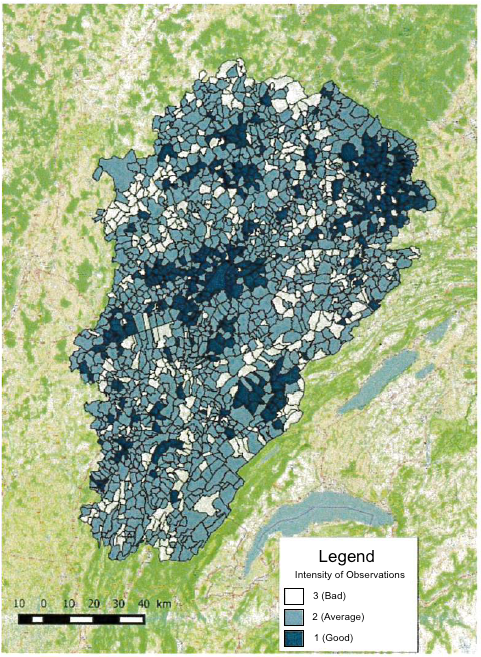
Index rating the quality of the estimators based on observations
All the data created with this workspace is available on the Sigogne GIS-Web Portal for public and stakeholder use. The data will be continuously updated and will help provide crucial data for future projects.
- Learn more about the project at sigogne.org and see the FME World Tour 2017 presentation
- Register for the FME World Tour 2018 to learn more in our “FME Around The World” session
- Tutorial: Getting Started with the RCaller
Data attribution

Liz Sanderson
Liz is Safe’s Knowledge & Community Specialist. She works on a variety of tutorials in our Community space to help users in their data journey.