 Ahoy, there! Prepare yourself for endless pirate puns as we set sail towards the statistical RCaller project taken on by a group of Safers. Every year for Innovation Daze, Safe’s developers (and often other teams) stop their regular work for one week to build their own passion projects using FME. This year, a multidisciplinary crew of pirates assembled to create a group of R and Python statistical transformers to help FME break into the world of data science.
Assembling the Crew
(Jolly) Roger assembled our crew: Sam, co-pirate who could write R; Iris and Olivia, snake charmers who could write Python; Liz, to document the journey; Chris, to turn a picture into a map; Nathan, to seek information for the voyage; Dan, the navigator to find the shortest path to the hidden treasure; and other Able Bodied Sailors to help with various tasks.
Building a Statistics Starter Set
With our crew aboard, we set sail across the Sea of Custom Transformers. Olivia started by creating a Shapiro-Wilk test using the PythonCaller and the SciPy package, while Sam did the same using the RCaller.
- The Shapiro-Wilk test determines whether a random data sample comes from a normal distribution.
Olivia worked her custom transformer magic to ensure our transformers could adequately handle rejected features and return FME error codes if they ran aground.
After completing the maiden voyage using both Python and R, we adjusted course to create the rest of the custom transformers just using the RCaller. We found that for our purposes, R could conduct many tests in a single line of code.
Liz packaged our custom transformers for uploading to the FME Hub. She also wrote an article showing how to conduct a Shapiro-Wilk test using our PyShapiroWilkCalculator or RShapiroWilkCalculator custom transformers. The article is a great resource if you want to get an overview of how to conduct statistical analysis using either language directly in FME Workbench.
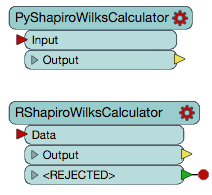
Python and R Shapiro-Wilk Calculator custom transformers
While Liz worked on the article, Sam and Olivia finished more basic statistical test custom transformers:
- ROneSampleTTestCalculator: Is the mean of my data significantly different from an assumed mean?
- RTwoSampleTTestCalculator: Are the means of my two samples significantly different?
- RCorrelationCalculator: Are my two variables associated?
- RClusterCalculator: Uses k-means to divide data into a prescribed number of clusters where each observation belongs to the cluster with the nearest mean
- RMinimumSpanningTree was packaged and put on the FME Hub.
While only scratching the surface of tests that might be useful to FME users, these serve as a good “statistics starter set.”
As our journey proceeded, some crew members took dinghies out to pursue their own adventures. Chris was able to add support for an R Raster Writer and read support for palettes, byte order, and interleaving (a feature appearing in FME 2018.1), Kevin successfully used R to detect changes in testsuite data, and Iris ended up prototyping FME workspaces as apps using FME Server.
With the last day of Innovation Daze approaching, our team realized that while we could show off our custom transformers, we did not have nice visual results illustrating the power of the RCaller for statistical analysis in FME. Therefore, Sam decided to pull together an example FME workspace in the few hours left in Innovation Daze. Together with FME Technology Expert Nathan, they built an example using the RClusterCalculator transformer and the USCensusCaller to conduct k-means cluster analysis on Orlando, Florida census data. This analysis produced a map with census tracts symbolized by cluster, a little more exciting than a p-value (for some, anyway!).
Example: Creating a Cluster Analysis Map with the RClusterCalculator
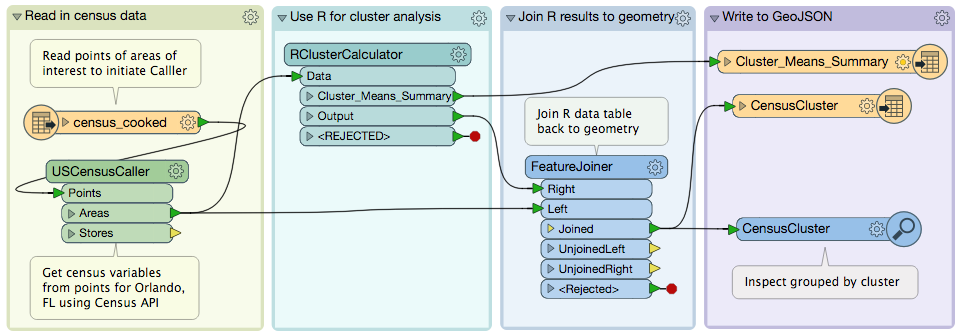
FME Workspace using the RClusterCalculator to determine clusters in census data. [Download FME Workspace]
Next, we sent the features to the RClusterCalculator. We specified the census variables as the attributes to analyze and asked for a 5 cluster solution. Then we used a FeatureJoiner to reconnect the attributes from RCaller back to the geometry using the GEOID attribute from the census. This is necessary because RCaller currently does not support geometry (add your support to this idea to request this feature).
Finally, we wrote our data. The features with the new ‘cluster’ attribute appended were written to the GeoJSON file CensusCluster.json and the means for each census attribute by cluster were written to a CSV table. We used an Inspector transformer to view the data grouped by cluster:
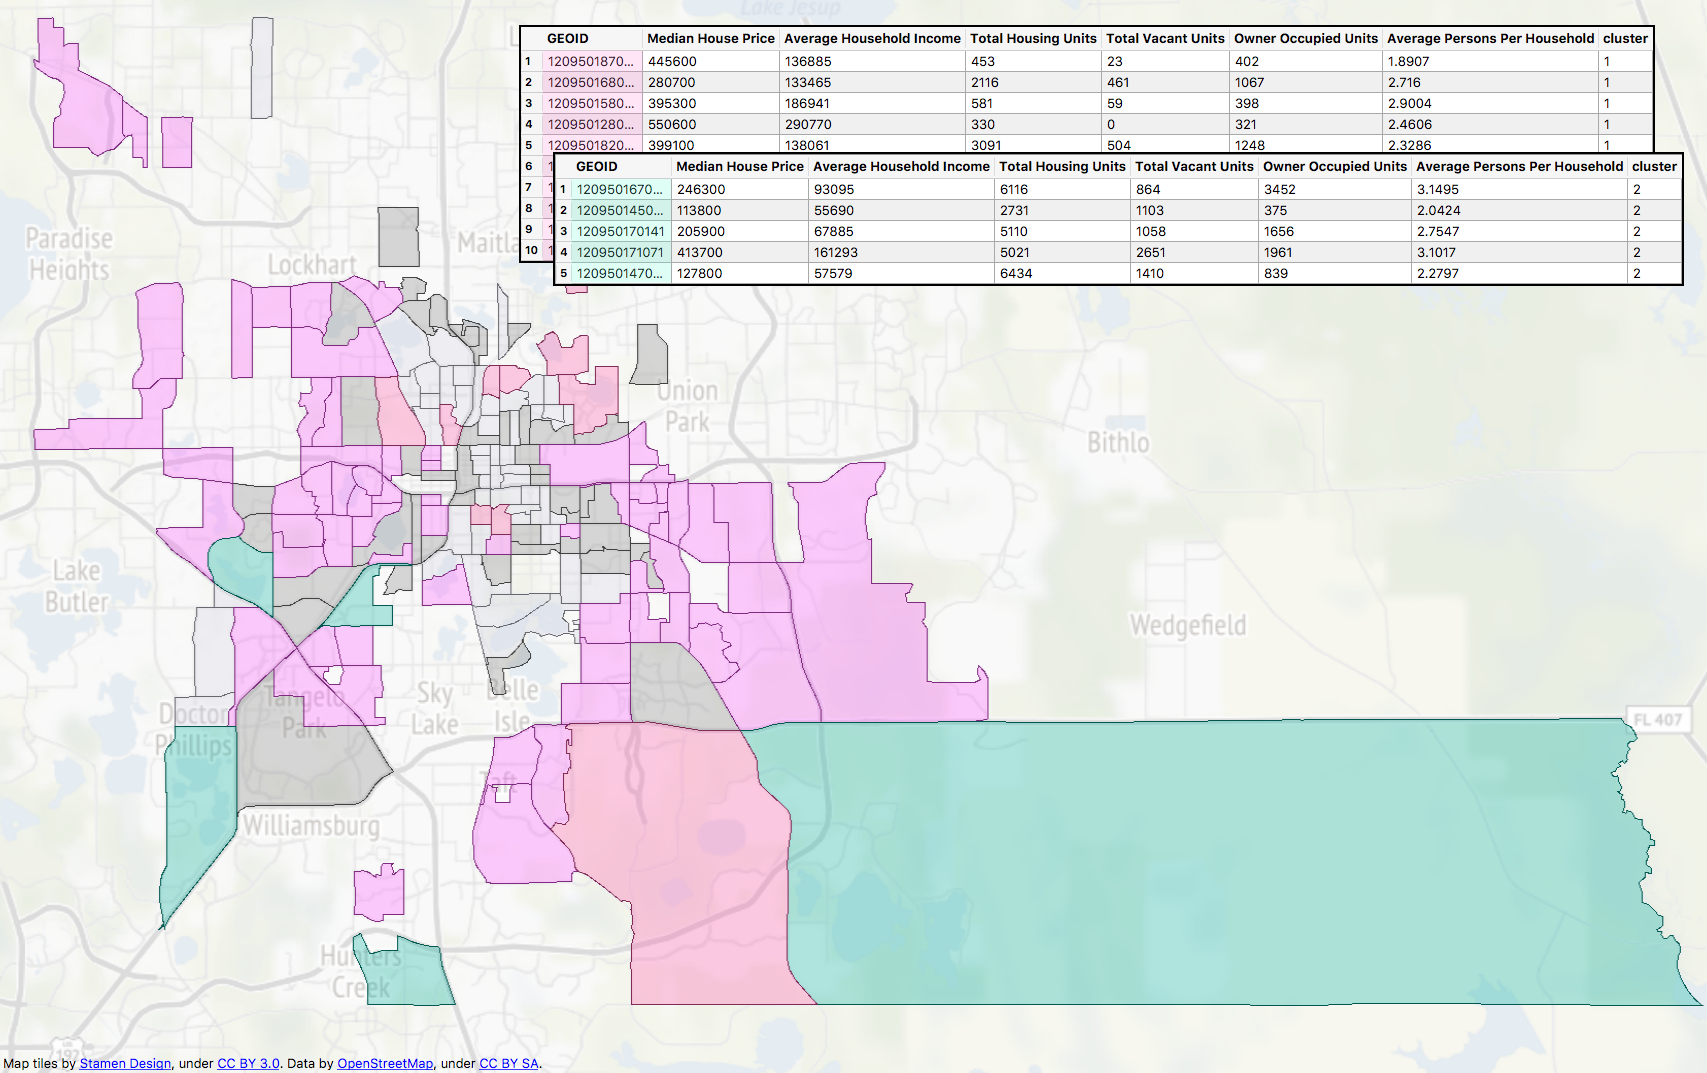
Output of the census clusters. Map tiles by Stamen Design, under CC-BY-3.0. Data by OpenStreetMap, under CC-BY-SA.
Calling all Statistics Enthusiasts
We built a starter set of statistics transformers using the RCaller for FME Hub, but we would love it if the FME community continued this effort. A huge number of tests and analyses could be packaged as custom transformers. Here are some we did not have time to create but would love to see on FME Hub:
- Mann–Whitney U test
- Kolmogorov and Smirnov test
- Fisher’s F test
- Chi-squared test
- ANOVA
- MANOVA
- OLS regression
- Factor analysis
- Principal Components Analysis
- Multidimensional Scaling
All of these can be implemented using RCaller, though some will require the installation of additional packages.
We would love to hear from you if you are using RCaller or any of these custom transformers. Additionally, check out the Ideas Forum to suggest new features for the RCaller or vote on existing ones.
Warning: Here There Be Monsters
-
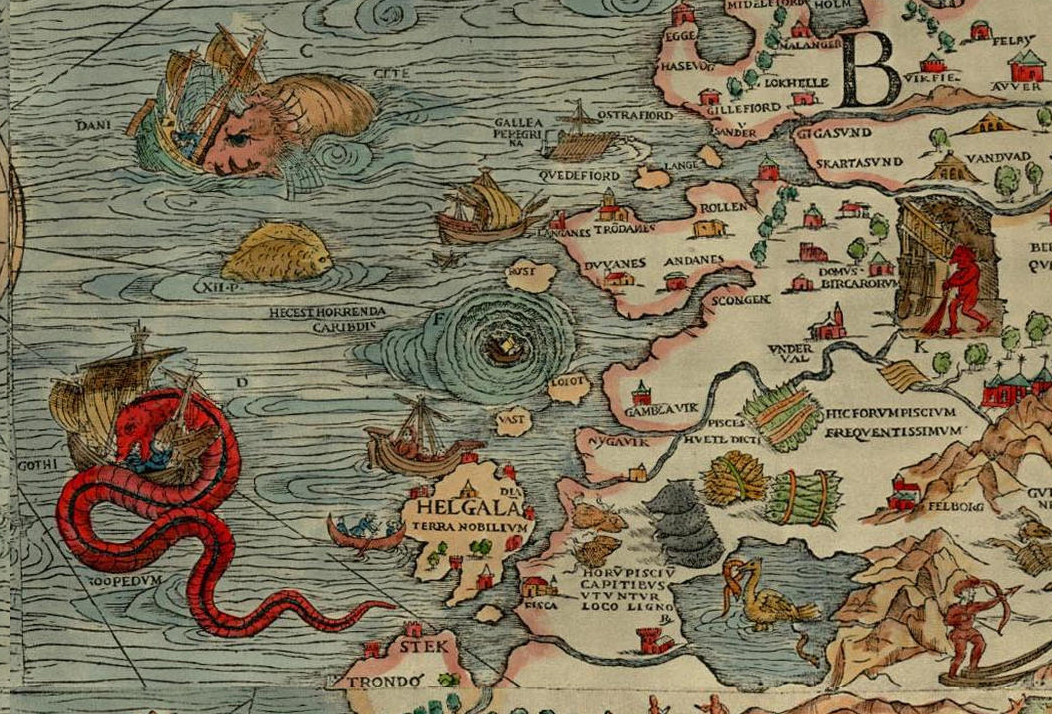
Detail of a Maelstrom from Carta Marina. Licensed under Creative Commons Attribution-Share Alike 3.0 Unported.
Statistics is complicated. Statistical computing using R and other related software makes conducting statistical analysis much easier. That is great! However, it is also easy to draw false conclusions when conducting statistical analysis, and the speed and accessibility of statistical computing can sometimes make this even easier. Therefore, caution must be exercised when putting this into practice. While we encourage everyone incorporating statistics into their work, we recommend doing your homework before jumping to conclusions. Here are some useful resources for learning statistics and R:
You can also check out our FME Knowledge Center articles on the RCaller.
Good luck on your own voyage across the Statistical Sea!

Liz Sanderson
Liz is Safe’s Knowledge & Community Specialist. She works on a variety of tutorials in our Community space to help users in their data journey.
Sam Walker
Sam is the Manager of Customer Education at Safe Software. He has a background in GIS and statistics and completed his Ph.D. doing research on urban environments.


